Interactive visualizations of personal income adjusted for regional price parity and personal consumption expenditures price index in states and metropolitan areas.
The Bureau of Economic Analysis, a division of the United States Department of Commerce, generates personal income data for states and metropolitan statistical areas. I present this data in two interactive visualizations, one for states, and a second for metros.
When presenting economic data, the term “real” commonly means that dollar amounts have been adjusted for the effects of inflation. That is the case for this data. BEA goes further in also adjusting data for regional price parity and personal consumption expenditures price index.
Regional price parity (RPP) measures the differences in prices among states and metro areas. A value is computed from the weighted value of a basket of goods and services. The value for the nation is set at 100. For states, the values range from, on the low side, Arkansas (85.3), Mississippi (86.0), and Alabama (86.4); to Hawaii (118.1), New York (116.4), and California (115.4) at the top. Kansas is at 90.0.
Then, BEA calculates the Implicit Regional Price Deflator, which is the price index. This is a measure of regional inflation.
More information about these methods can be found at BEA in the document Real Personal Income and Regional Price Parities.
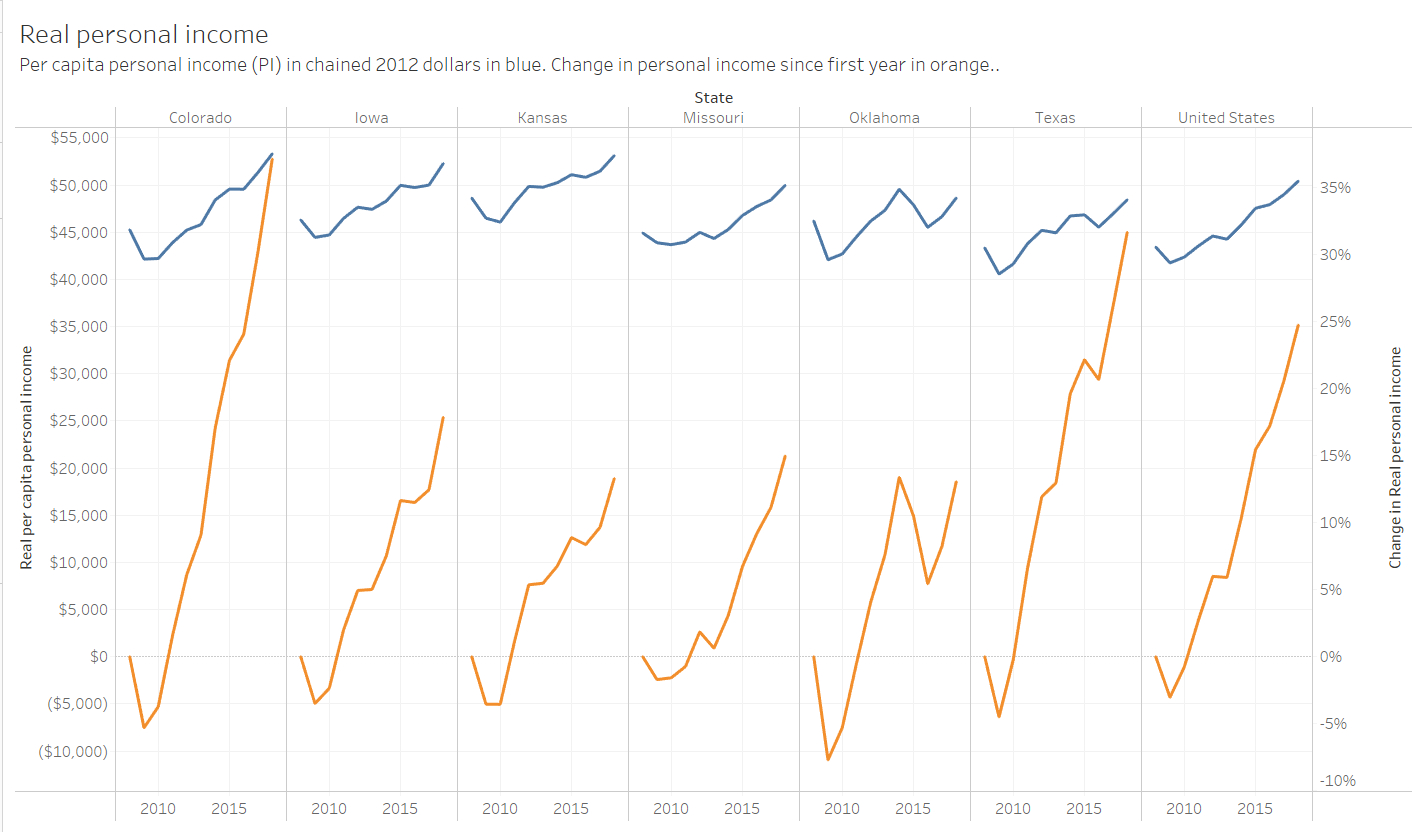
The difference when using values adjusted for regional differences can be substantial. For example, when considering per capita personal income in actual, non-adjusted dollars, Kansas ranked number 23 among the states, which is a typical value for Kansas. When adjusted for region, Kansas ranked number 16. In a nearby example from the visualization, the value of per capita personal income for Kansas is better than other states, but is growing slowly. This is easily seen when comparing Colorado to Kansas.

In the example for metro areas in Kansas, Wichita’s per capita personal income is high, but growing slower than some areas, including the nation. (The Kansas City metro area includes Kansas City, Missouri and other areas in Missouri.)

Click here to access the visualization for states.
Click here to access the visualization for metro areas.
For more visualizations, click here.