Tag: Economic development
-

Wichita jobs and employment, October 2019
For the Wichita metropolitan area in October 2019, the labor force is up, the number of unemployed persons is down, the unemployment rate is down, and the number of people working is up when compared to the same month one year ago. Seasonal data shows small increases in labor force and jobs from September.
-

The Wichita baseball team’s name
Is the name of the new Wichita baseball team important? Yes, as it provides insight.
-

Sedgwick County talent attraction
In an index ranking counties in talent attraction, Sedgwick County has not performed well.
-

Wichita personal income grows
Wichita personal income grew at a faster rate in 2018.
-
Wichita jobs and employment, September 2019
For the Wichita metropolitan area in September 2019, the labor force is up, the number of unemployed persons is down, the unemployment rate is down, and the number of people working is up when compared to the same month one year ago. Seasonal data shows small increases in labor force and jobs from August.
-

Wichita jobs and momentum
Given recent data and the CEDBR forecasts, Wichita’s momentum is a slowly growing economy, with the rate of growth declining.
-

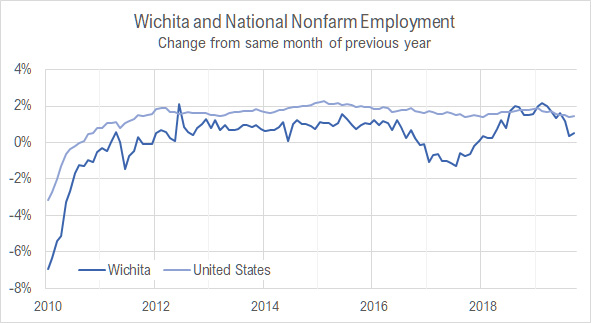
Looking at jobs in Wichita
Examining job creation in Wichita as compared to the state and the nation.
-

Checking a Jeff Longwell for Mayor political ad
An ad from the Jeff Longwell for Mayor Committee contains a false claim.
-

In Wichita, more tax increment financing
The Wichita city council will consider expanding an existing TIF, or tax increment financing district.
-

What the Block 1 amendment says about downtown Wichita
The amending of a retail lease tells us a lot about the economics of downtown Wichita.
-

Wichita jobs and employment, August 2019
For the Wichita metropolitan area in August 2019, the labor force is up, the number of unemployed persons is down, the unemployment rate is down, and the number of people working is up, all by small amounts, when compared to the same month one year ago. Seasonal data shows small increases in labor force and…
-

Metro Monitor for Wichita, 2019 edition
In a report looking at the economics of the 100 largest metropolitan areas, Wichita often ranks near the bottom.