Tag: Economic development
-

Wichita job growth
Wichita economic development efforts viewed in context.
-
Sales tax incentives yes, but no relief on grocery sales tax
Is it equitable for business firms to pay no sales tax, while low-income families pay sales tax on groceries?
-
Century II: The consultant’s disclaimer
The report produced for the City of Wichita on Century II has a disclaimer that absolves pretty much everyone from any accountability.
-

Century II resource center
A resource of information about the Century II Performing Arts and Convention Center in Wichita.
-
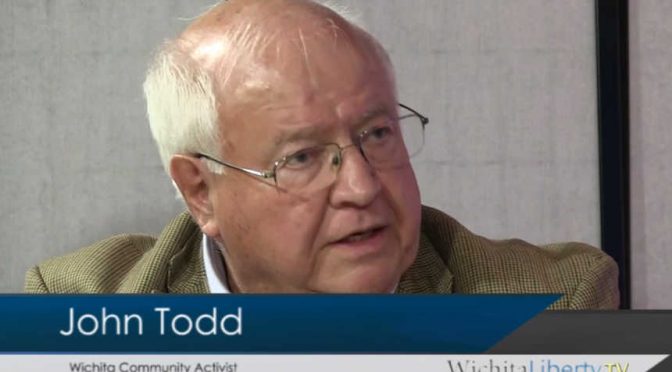
WichitaLiberty.TV: Century II, Its Future
Community influencer John Todd joins Karl Peterjohn and Bob Weeks to discuss Century II, Wichita’s convention and performing arts center.
-
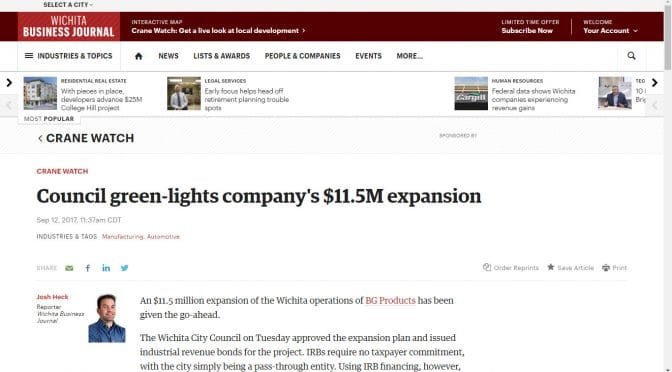
Wichita Business Journal grants city council excess power
The Wichita Business Journal and the City of Wichita team to provide incorrect coverage and missing analysis.
-

WichitaLiberty.TV: Wichita and Kansas economies
In this episode of WichitaLiberty.TV: Bob Weeks and Karl Peterjohn discuss issues regarding the Wichita and Kansas economies.
-

In Wichita, not your tax dollars
At a Wichita City Council meeting, citizens are told, “These tax dollars are not your tax dollars.”
-

Redesigned Naftzger Park likely not only subsidy
The developers of property near Naftzger Park in downtown Wichita will possibly receive millions in other subsidy.
-
Naftzger Park land ownership
One of the issues surrounding Naftzger Park in downtown Wichita is land ownership.
-

Naftzger Park public hearing
On Tuesday August 15 the Wichita City Council will hold a public hearing to consider authorizing spending TIF funds on Naftzger Park.
-

WichitaLiberty.TV: Naftzger Park
Wichita Assistant City Manager and Director of Development Scot Rigby joins hosts Bob Weeks and Karl Peterjohn to discuss the plans for Naftzger Park. Then, Bob and Karl continue the discussion.