Tag: Economics
-
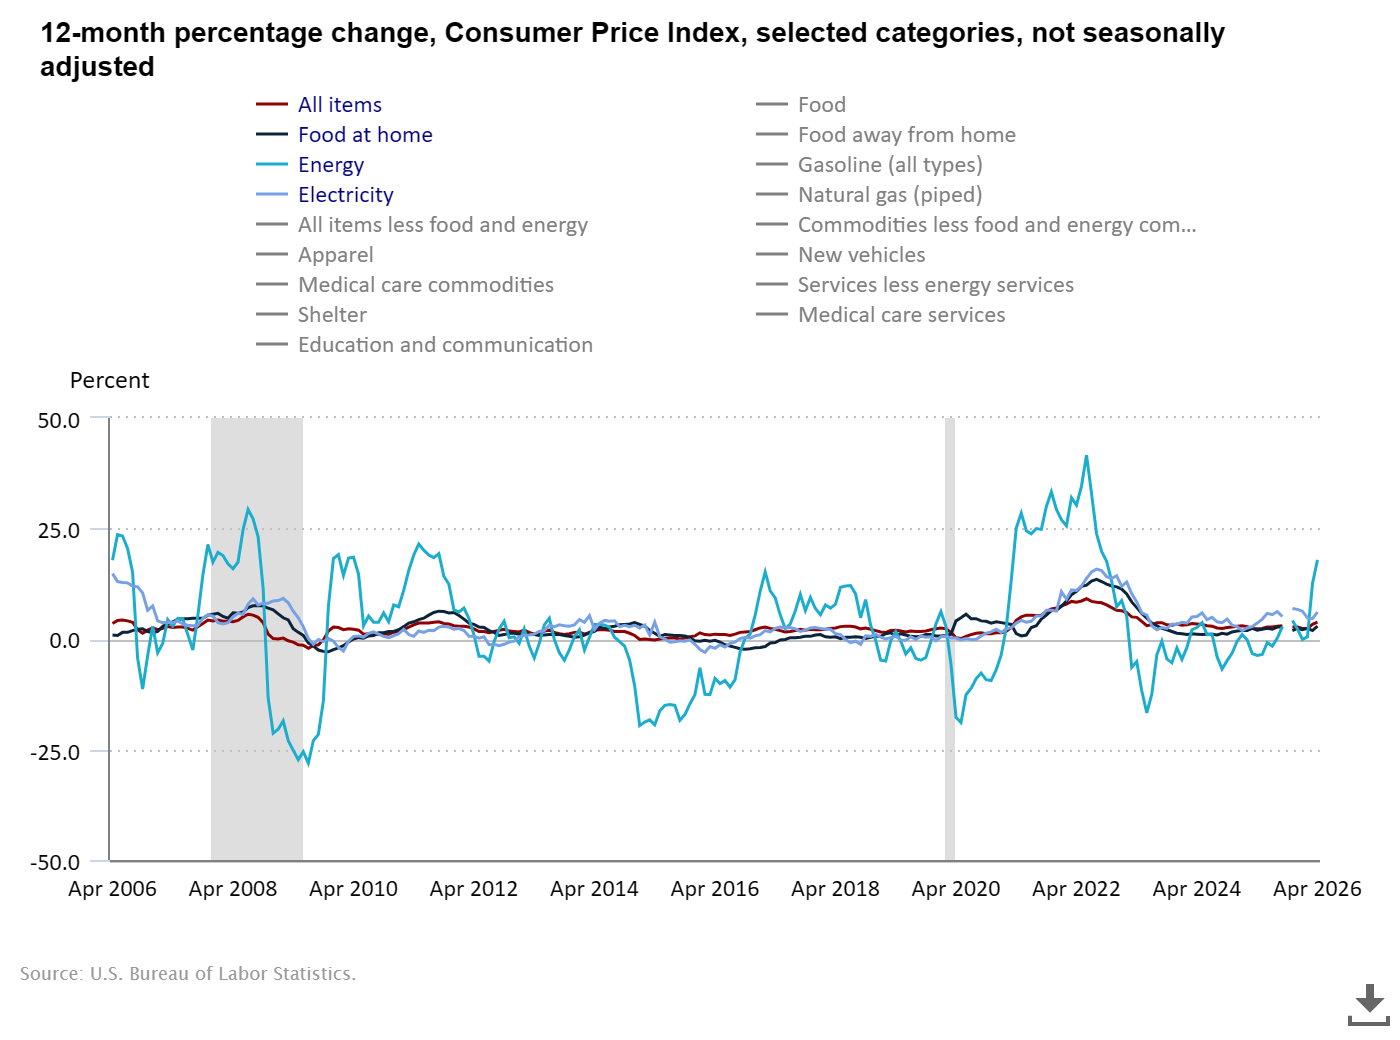
Inflation Accelerated in April 2026: Energy Prices Drive CPI to 3.8% — Highest in Three Years
Inflation accelerated sharply in April 2026, with consumer prices rising 3.8% over the past year — the fastest pace since May 2023. Energy costs, led by a 28.4% annual surge in gasoline, drove more than 40 cents of every dollar of monthly price growth.
-
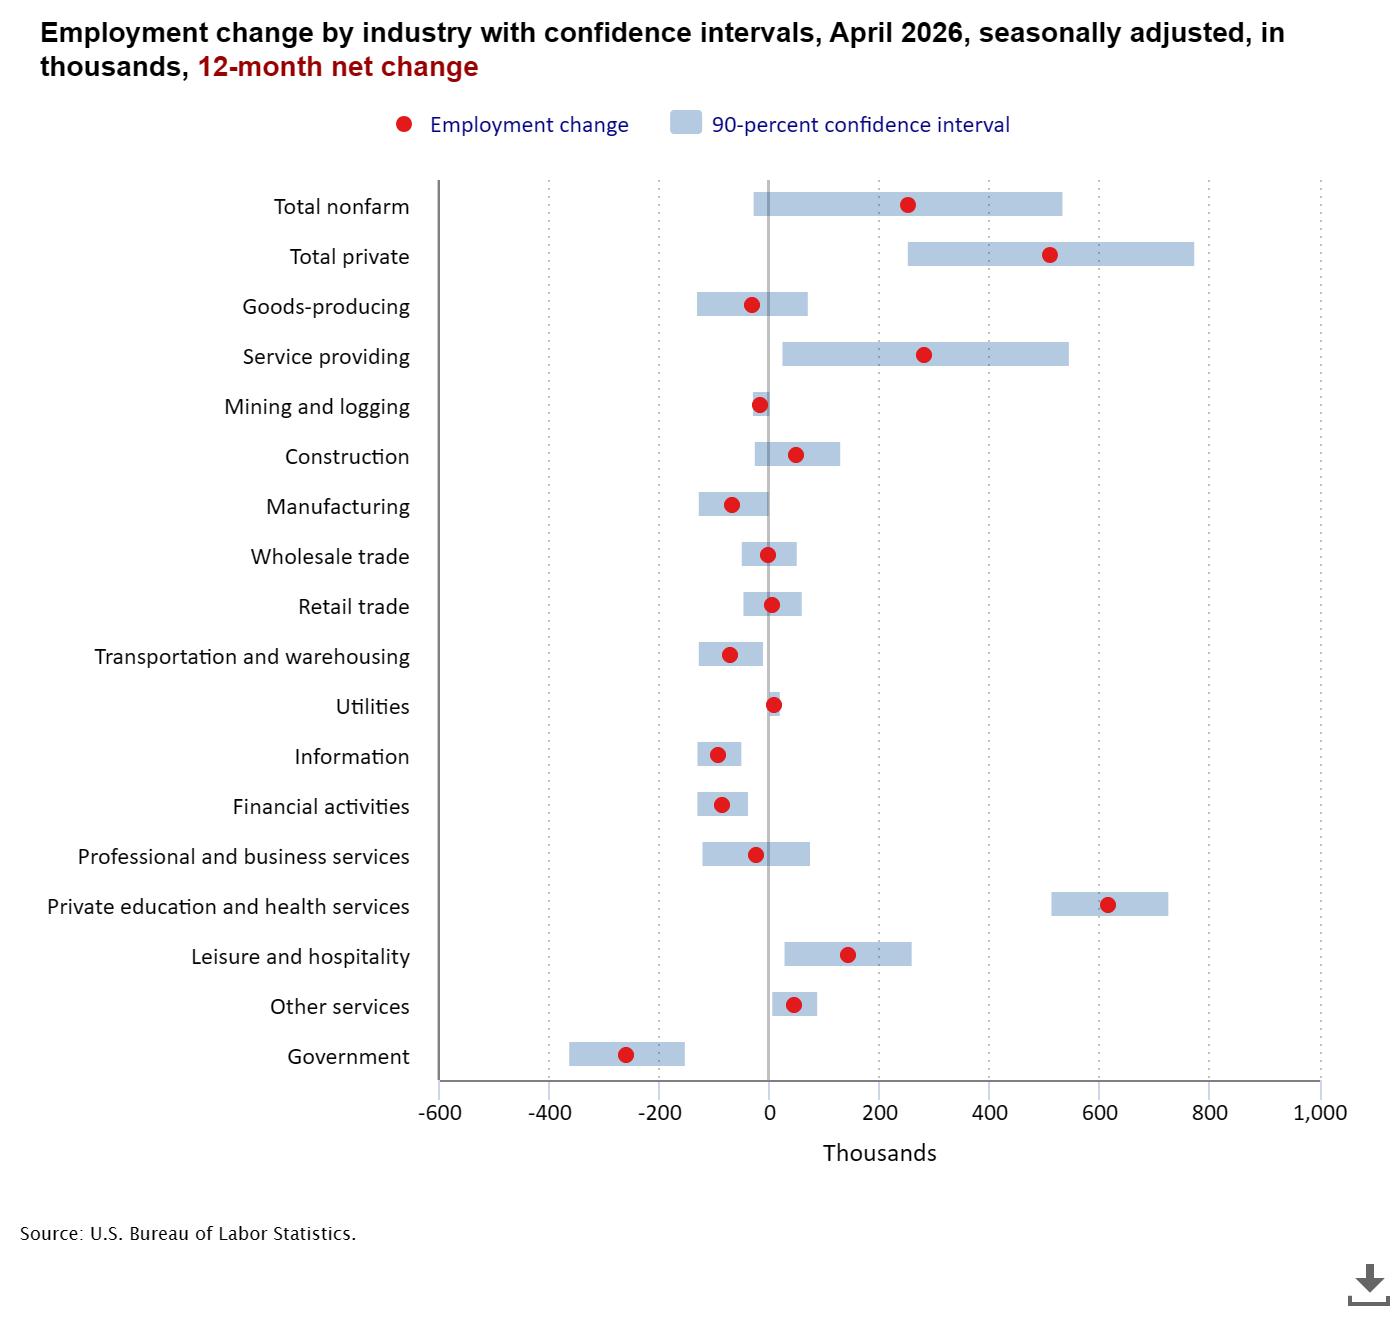
April 2026 Jobs Report: Hiring Slows Sharply as Federal Cuts Mount
The April 2026 jobs report delivered a clear warning: U.S. hiring is slowing fast. Employers added only 115,000 jobs last month, well short of expectations, while the three-month average has tumbled to just 48,000 — the weakest sustained pace in years.
-
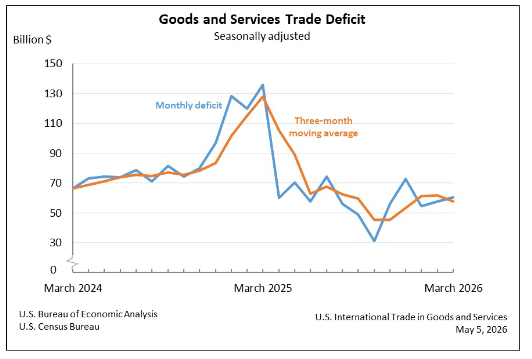
Trade Deficit Rose to $60.3 Billion in March, but the Year-Over-Year Story Is Dramatic
The U.S. trade deficit widened modestly to $60.3 billion in March 2026, but the headline number obscures a remarkable year-over-year story: the gap is 55% smaller than a year ago, as importers no longer need to front-run tariffs.
-
Kevin Hassett Fact-Check: Iran War Claims & Economic Data
White House economic advisor Kevin Hassett made a string of economic claims on Face the Nation — some accurate, some misleading, and one outright false. This fact-check grades each one against primary sources, from IRS filing data to historical GDP records.
-
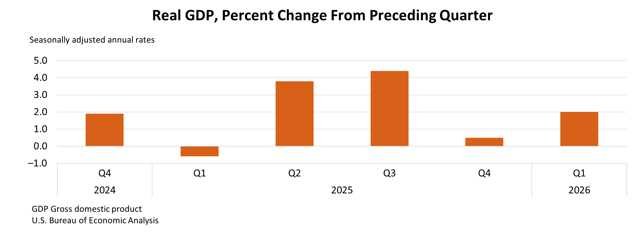
U.S. GDP Q1 2026: Growth Rebounds but Inflation Surges to 4.5%
The U.S. economy appears to have rebounded strongly in early 2026, growing at a 2.0% annual rate after nearly stalling in late 2025. But beneath that headline lies a harder story: inflation is surging back, consumers are pulling back, and much of the growth may be a statistical mirage.
-
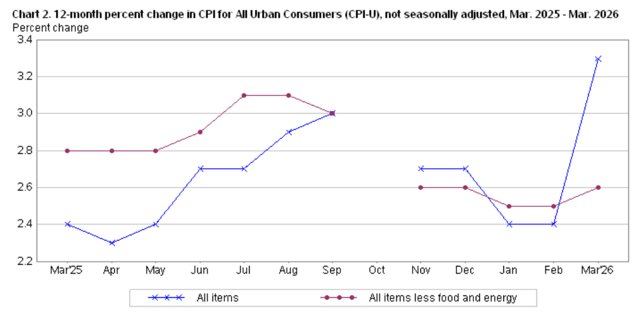
Inflation Surged in March 2026 as Gasoline Prices Drove the Biggest Monthly Jump in Nearly Four Years
Inflation surged 0.9% in March — the biggest monthly jump since June 2022 — as gasoline prices posted their largest single-month increase on record. The annual rate climbed to 3.3%, well above February’s 2.4%.
-
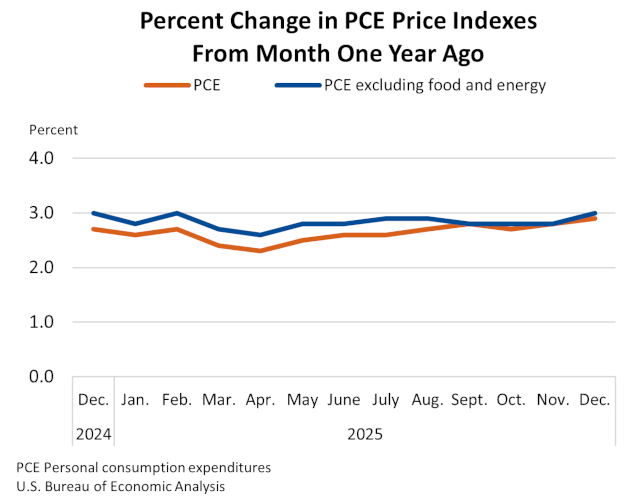
December 2025 PCE Report: Inflation Ticks Up, Savings Drop, and Spending Holds On
The BEA’s December 2025 Personal Income and Outlays report shows inflation rising to 2.9% annually while Americans dip into savings to keep spending. Here’s what it means for your wallet and the Fed’s next move.
-
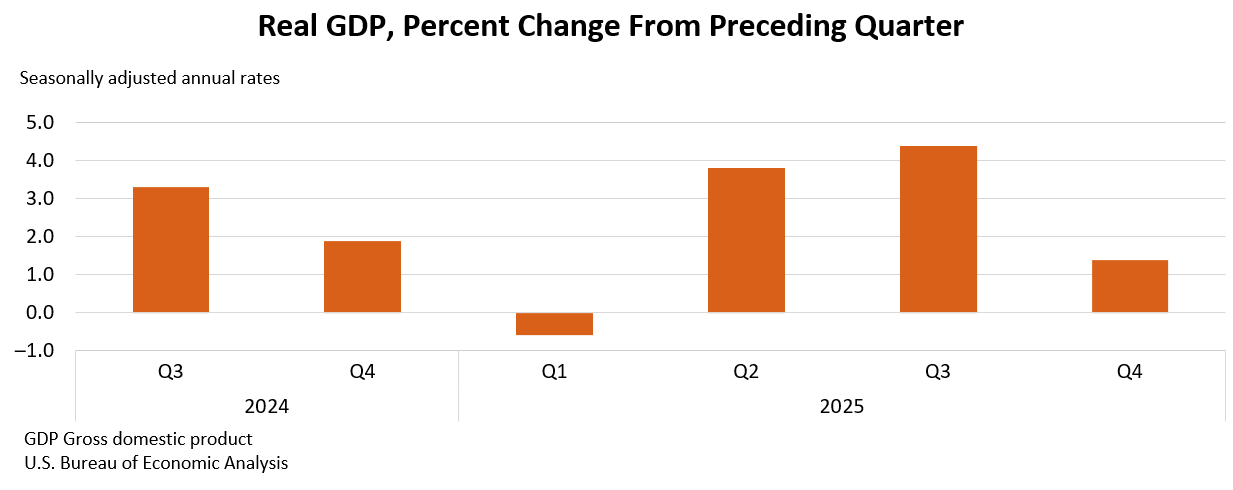
Q4 2025 GDP: Why the 1.4% Growth Rate Is Misleading — And What the Real Number Is
The government reported 1.4% GDP growth for Q4 2025, a sharp drop from summer’s 4.4% pace. But a six-week federal shutdown distorted the numbers. Strip that out and the private economy grew 2.4% — a healthy pace. Here’s a plain-English breakdown of what really happened.
-
January 2026 Jobs Report: 130K Jobs Added, But Massive Revisions Reveal 2025 Was Far Weaker Than Reported
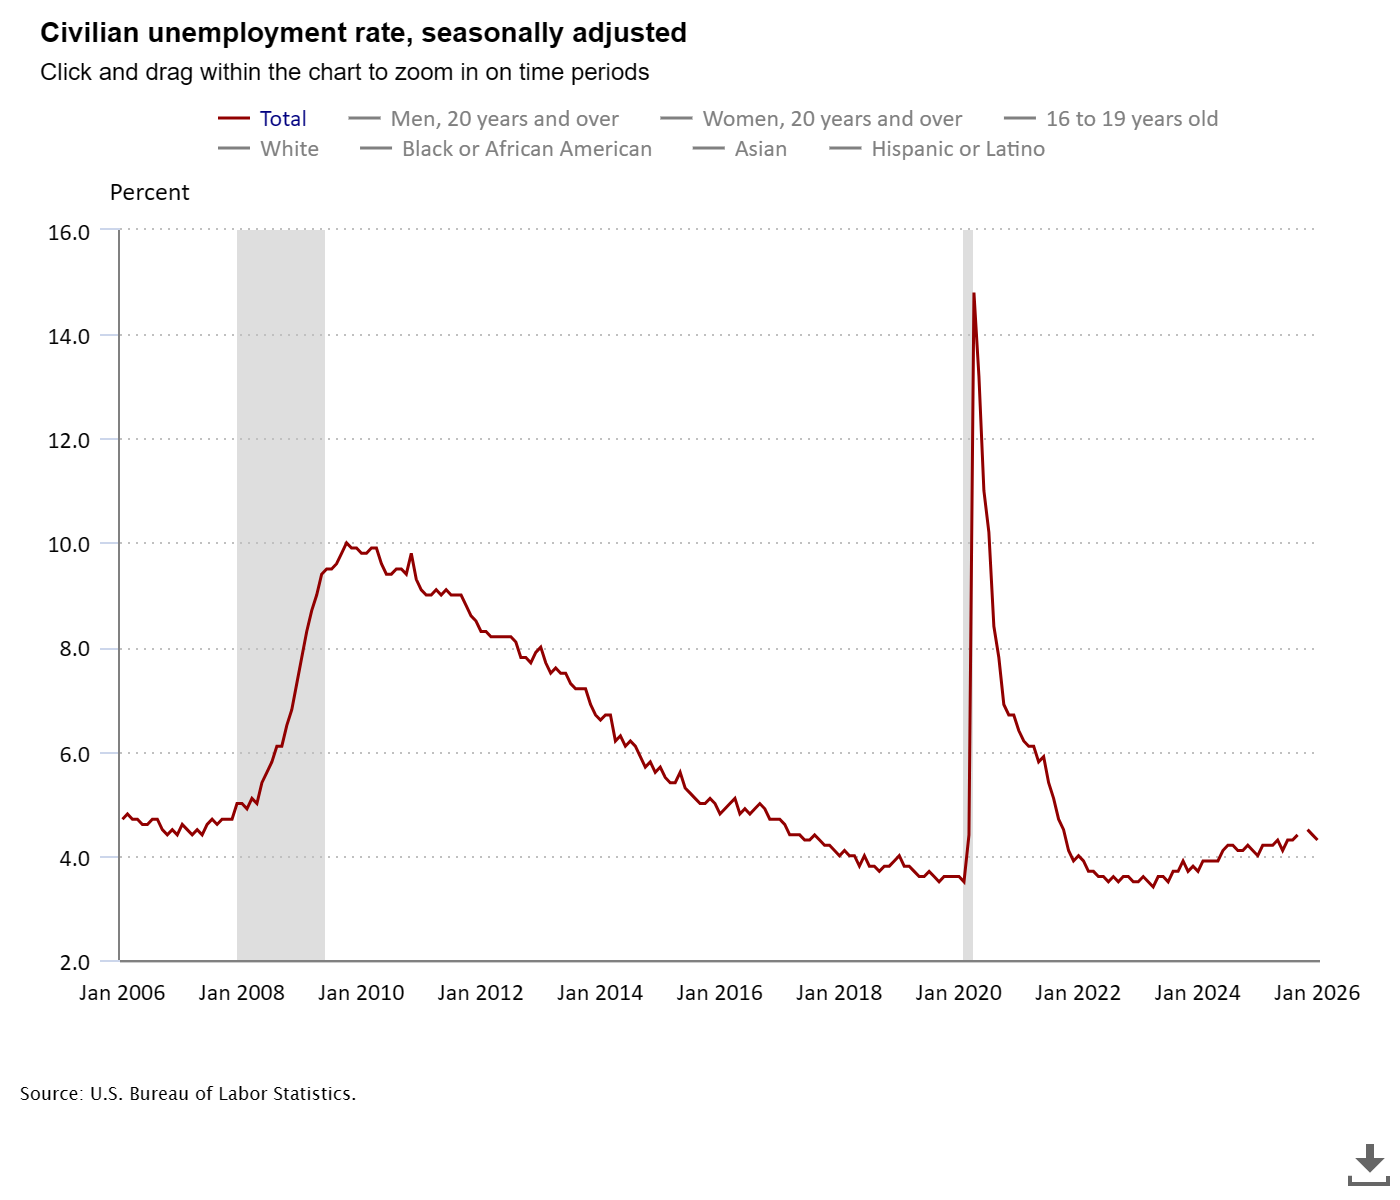
The U.S. added 130,000 jobs in January 2026 while the unemployment rate held steady at 4.3%. Health care, social assistance, and construction led gains, while federal government and financial activities cut jobs. Benchmark revisions sharply reduced 2025 job growth totals.
-
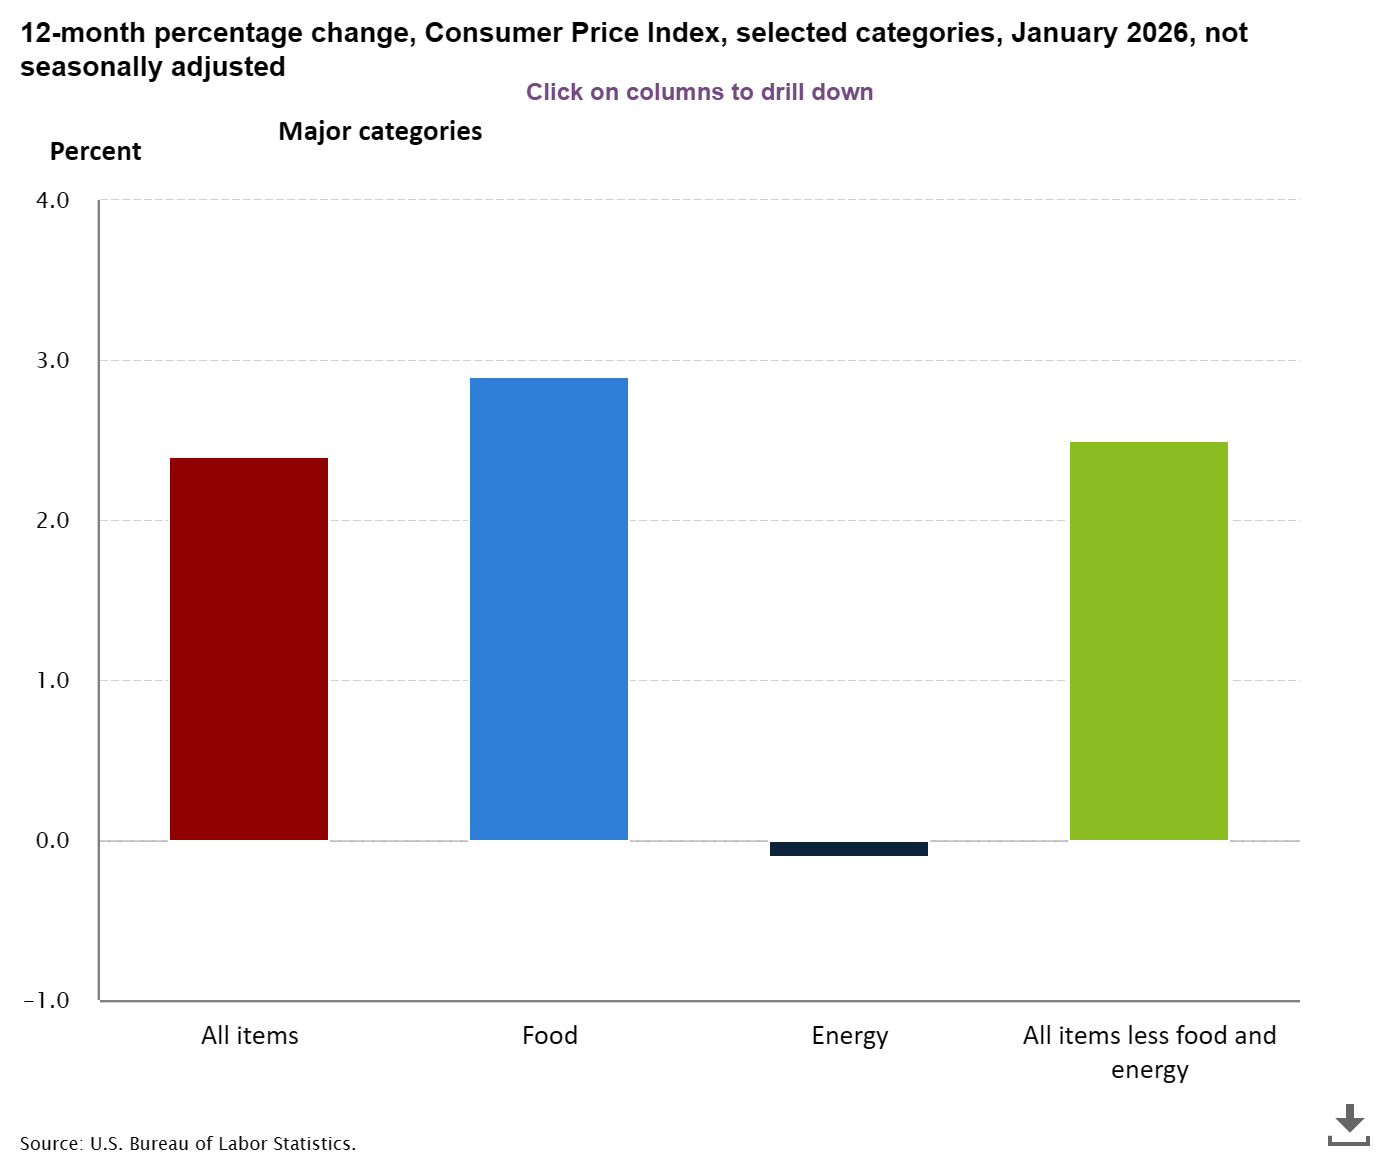
January 2026 Inflation Report: CPI Drops to 2.4% as Price Pressures Ease
The Consumer Price Index for January 2026 shows inflation continuing its gradual decline to 2.4% annually, down from 2.7% in December. While energy prices provided relief with gasoline down 3.2% for the month, housing costs and services inflation remain persistent challenges for American households.
-

There Are No Good Reasons to Subsidize Stadiums. Governments Keep Doing It.
Despite decades of economic evidence showing that publicly funded sports stadiums fail to deliver promised benefits, governments continue to spend billions subsidizing wealthy team owners, often at the expense of taxpayers and public trust.
-

Donald J. Trump: “My Tariffs Have Brought America Back”
President Donald Trump argues that his sweeping tariffs have produced extraordinary economic growth, low inflation, booming investment, and enhanced national security, proving critics wrong.