Tag: Economics
-
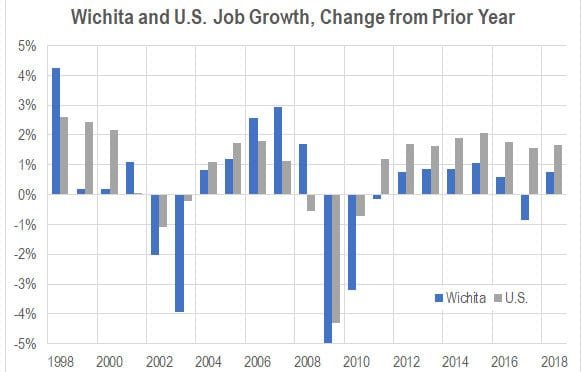
Wichita employment to grow in 2019
Jobs are forecasted to grow in Wichita in 2019, but the forecasted rate is low.
-
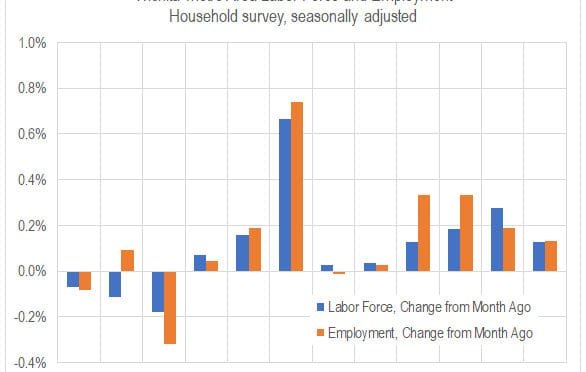
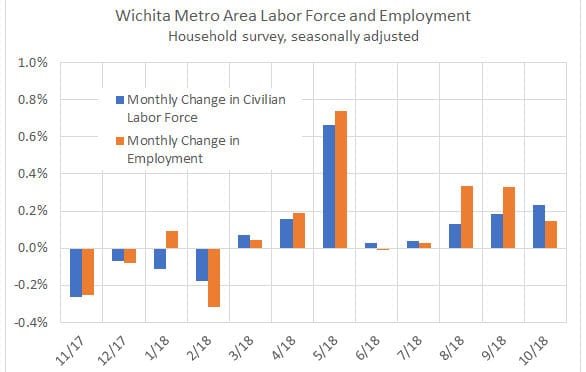
Wichita employment, November 2018
For the Wichita metropolitan area in November 2018, jobs are up, the labor force is up, and the unemployment rate is down, compared to the same month one year ago. Seasonal data shows a slowdown in the rate of job growth.
-
Kansas jobs, November 2018
For November 2018, a growing labor force and more employment, but growing more slowly from October.
-
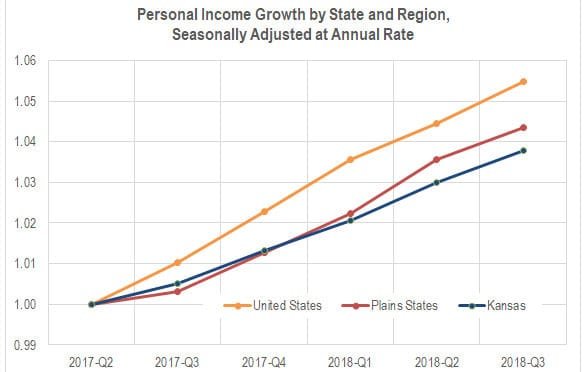
Kansas personal income rises
Kansas personal income grew in the third quarter of 2018, but slower than in most states.
-
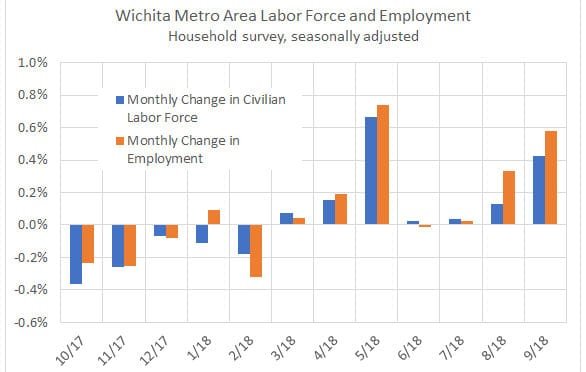
Wichita employment, October 2018
For the Wichita metropolitan area in October 2018, jobs are up, the labor force is up, and the unemployment rate is down, compared to the same month one year ago. Seasonal data shows a slowdown in the rate of job growth.
-

WichitaLiberty.TV: Economic development incentives
A look at some economic development incentive programs in Wichita and Kansas. Second in a series. Tax increment financing (TIF) is prominent in this episode.
-
Sedgwick County jobs, second quarter 2018
For the second quarter of 2018, the number of jobs in Sedgwick County grew slightly slower than the nation.
-

Kansas jobs, October 2018
For October 2018, an expanding labor force in Kansas, and a slight increase in jobs from September.
-

WichitaLiberty.TV: Economic development incentives
A look at some economic development incentive programs in Wichita and Kansas. First in a series.
-
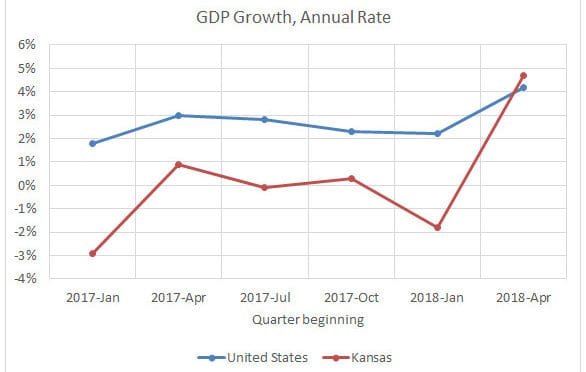
Kansas GDP growth spurt
In the second quarter of 2018, the Kansas economy grew at the annual rate of 4.7 percent, the seventh-best rate in the nation.
-

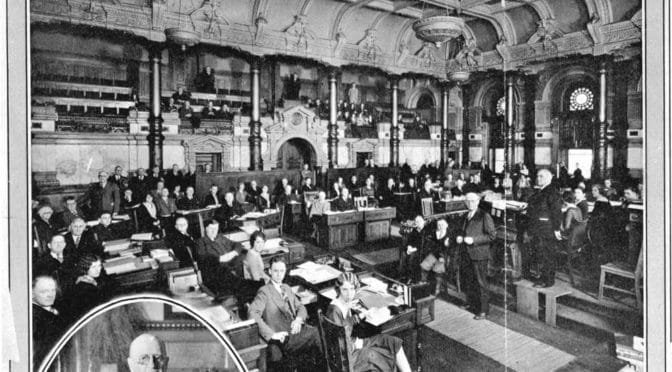
Kansans voted for growth, not stagnation
Kansans need of a new way of thinking. They won’t get that from a Democrat or Republican as governor, writes Michael Austin, Director of the Sandlian Center for Entrepreneurial Government at the Kansas Policy Institute.
-
Wichita employment, September 2018
For the Wichita metropolitan area in September 2018, jobs are up, the labor force is up, and the unemployment rate is down, compared to the same month one year ago.