Tag: Economics
-
Kansas and Wichita jobs, July 2018
For July 2018, more jobs in Kansas, and a nearly unchanged labor force. Wichita jobs also rose.
-
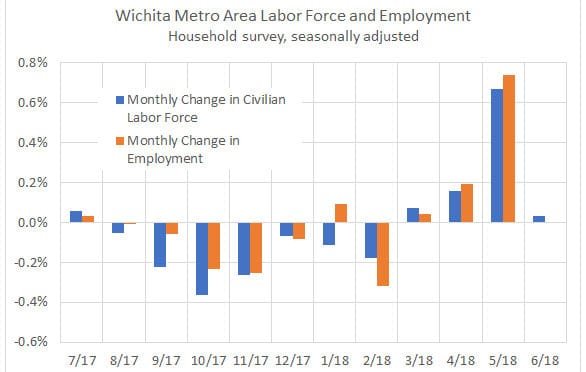
Wichita employment, June 2018
For the Wichita metropolitan area in June 2018, jobs are up, the unemployment rate is down, and the labor force is smaller, compared to the same month one year ago.
-
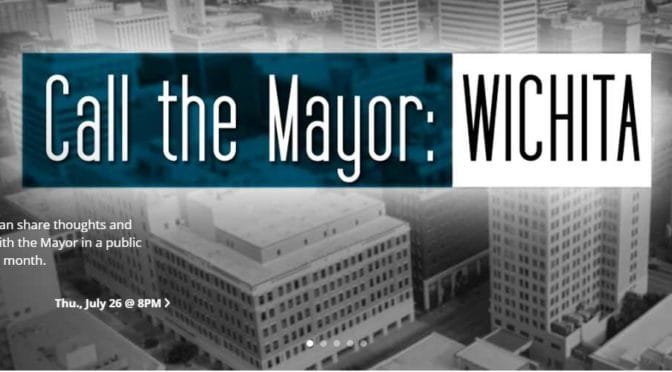
The Wichita Mayor on employment
On a televised call-in show, Wichita Mayor Jeff Longwell is proud of the performance of the city in growing jobs.
-

Kansas GDP growth slows
In the first quarter of 2018, the Kansas economy grew at the annual rate of 0.5 percent in real terms, slowing from the previous quarter.
-

Kansas and Wichita jobs, June 2018
For June 2018, more jobs in Kansas, and a nearly unchanged labor force. Wichita jobs also rose.
-

Kansas candidate briefings
Recently Kansas Policy Institute, along with Americans for Prosperity and Kansas Chamber of Commerce, held a series of briefings for candidates for the Kansas Legislature.
-
Kansas government employees
Kansas has a lot of government employees when compared to other states, and especially so in education.
-
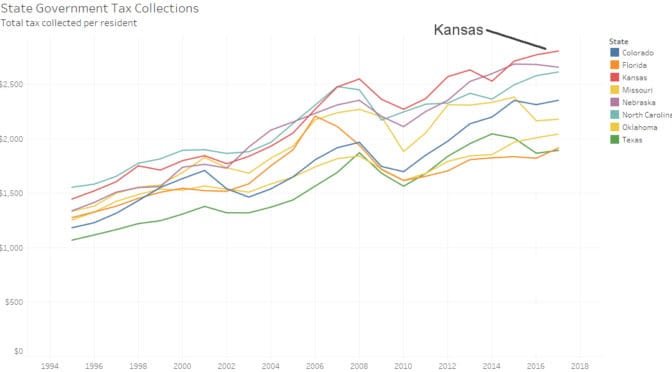
Kansas tax collections
If Kansas government doesn’t have enough money to meet spending requests, it’s not for the lack of collecting taxes.
-

Wichita jobs up
Wichita employment trends are positive for three consecutive months.
-
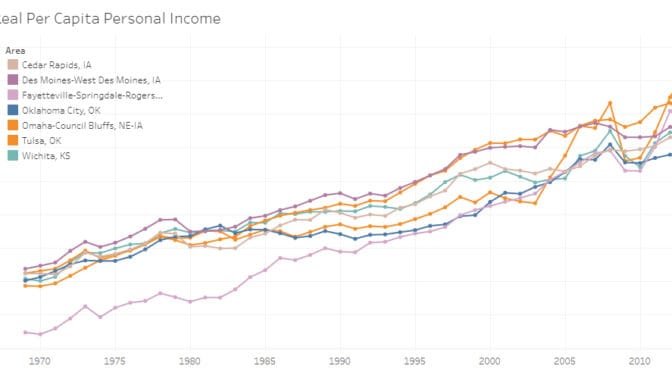
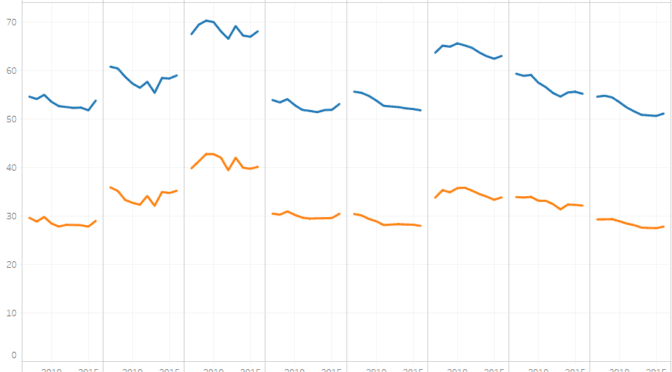
Wichita and Midwest income
A look at income in Wichita compared to other Midwest cities.
-

Kansas personal income, first quarter 2018
Kansas personal income rose at the annual rate of 4.2 percent in the first quarter of 2018, compared to the previous quarter.
-

Airport traffic statistics, 2017
Airport traffic data presented in an interactive visualization, updated through 2017.