Tag: Economics
-

Sedgwick County jobs
Sedgwick County had fewer jobs in 2017 than in 2016.
-

Wichita unemployment rate falls
For April 2018, the unemployment rate in the Wichita metropolitan area fell, and the number of jobs grew.
-

Wichita in ‘Best Cities for Jobs 2018’
Wichita continues to decline in economic vitality, compared to other areas.
-

Kansas employment
Kansas employment statistics through April 2018.
-

Personal income in Kansas and Wichita
Personal income in Wichita and Kansas has declined.
-
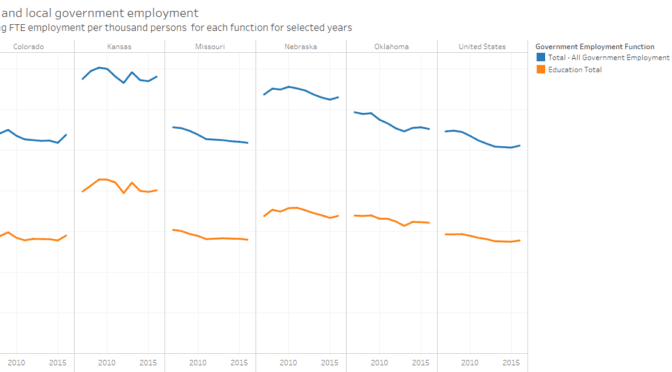
State and local government employee and payroll
Considering all government employees in proportion to population, Kansas has many compared to other states, and especially so in education.
-

Wichita metropolitan area population in context
The growth of population in Wichita compared to other areas.
-
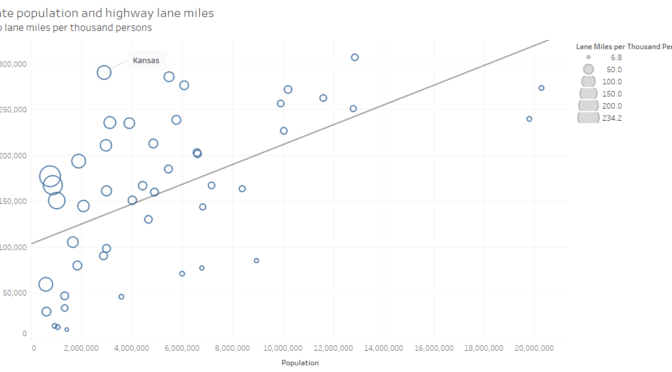
Visualization: Highways in the states
An interactive visualization of highway statistics for the states.
-
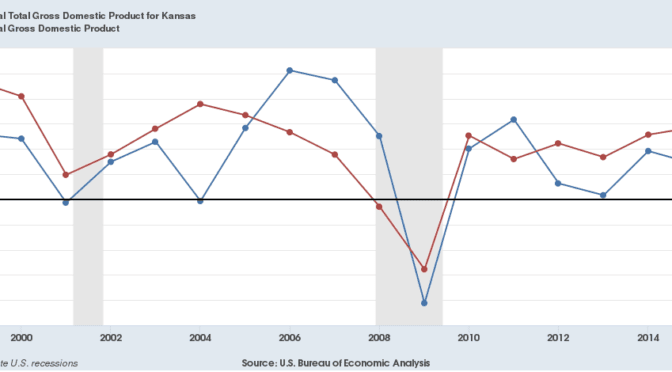
Kansas gross domestic product
Kansas and United States gross domestic product.
-
Kansas GDP falls
For 2017, the Kansas economy shrank, and just two states performed worse.
-
Wichita unemployment rate falls
The unemployment rate in the Wichita metropolitan area fell. So too did the number of jobs.
-
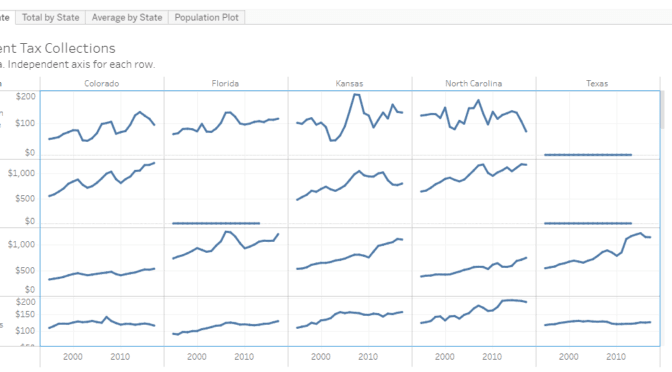
State government tax collections
An interactive visualization of tax collections by state governments.