Tag: Economics
-
WichitaLiberty.TV: Russ McCullough, Ottawa University and Gwartney Institute
Dr. Russ McCullough of Ottawa University introduces us to the Gwartney Institute and explains the importance of economic freedom.
-
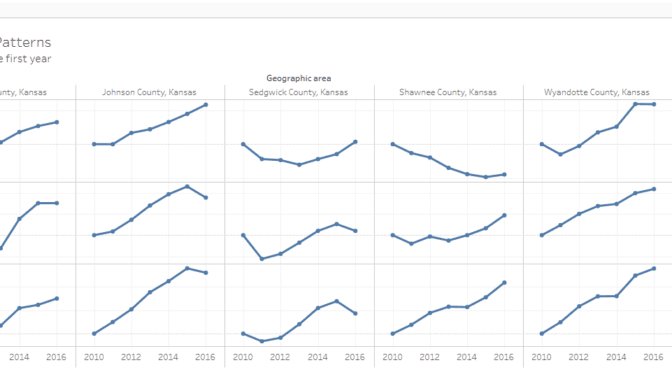
Business patterns in Kansas counties
Census data shows that some counties in Kansas are growing faster than others.
-

Why Wichita may not have the workforce
If Wichita-area companies can’t fill jobs, the declining labor force may be the reason. Who is responsible?
-
Kansas and national jobs, March 2018
Over the past year, Kansas job growth trailed the nation, except in government.
-

Intrust Bank Arena loss for 2017 is $4,222,182
As in years past, a truthful accounting of the finances of Intrust Bank Arena in downtown Wichita shows a large loss.
-

Project Wichita, remember Visioneering Wichita
As Project Wichita gets ready to gather information and set goals, let’s be aware that we’ve done this before, and not long ago.
-
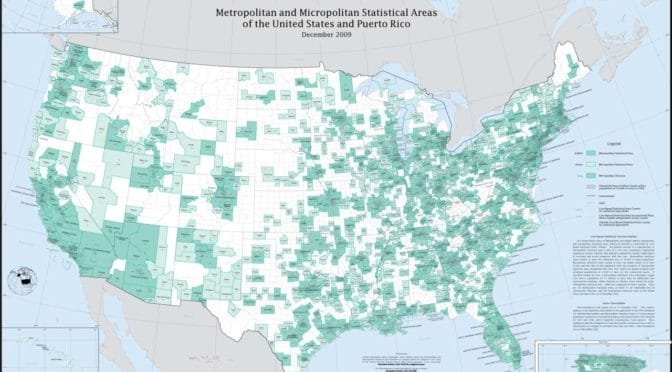
Sorting and polarizing in America
American cities are changing with domestic migration. Kansas data excerpted.
-

Project Wichita right to look ahead at city’s future
We can understand self-serving politicians and bureaucrats. It’s what they do. But a city’s newspaper editorial board ought to be concerned with the truth.
-

WichitaLiberty.TV: Larry Reed, Foundation for Economic Education
Lawrence W. Reed, President of Foundation for Economic Education, joins Bob and Karl to discuss the connection between liberty and character, our economic future, and I, Pencil.
-

Wichita employment down, year-over-year
At a time Wichita leaders promote forward momentum in the Wichita economy, year-over-year employment has fallen.
-
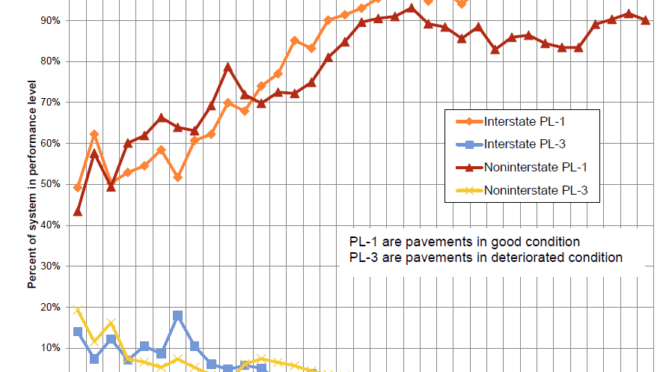
Kansas highways set to crumble, foresees former budget director
Duane Goossen, former high Kansas government official, says the state’s highways are in trouble. What is his evidence?
-

WichitaLiberty.TV: Dr. Wolf von Laer of Students for Liberty
Dr. Wolf von Laer of Students for Liberty joins Bob and Karl to talk about young people and the cause of liberty.