Tag: Economics
-
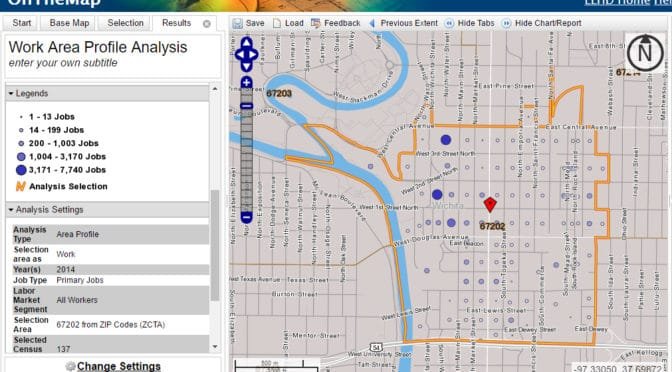
Census data for downtown Wichita workers
Is the presentation of the number of workers in downtown Wichita an innocent mistake, mere incompetence, or a willful lie?
-
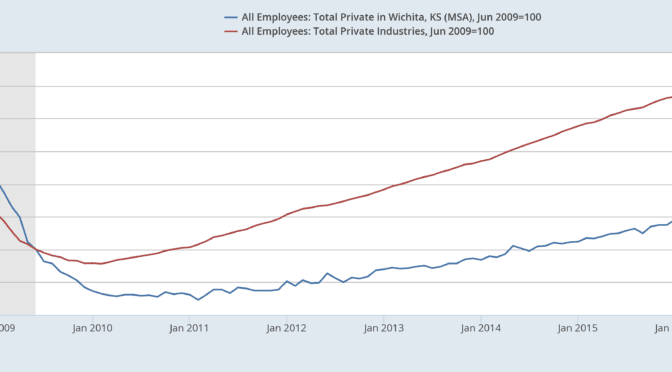
Wichita post-recession job growth
Wichita has recovered from recessions, but after the most recent, the city is falling further behind.
-

Downtown Wichita jobs, sort of
The claim of 26,000 workers in downtown Wichita is based on misuse of data so blatant it can be described only as malpractice.
-

Rich States, Poor States, 2107 edition
In Rich States, Poor States, Kansas improves its middle-of-the-pack performance, but continues with a mediocre forward-looking forecast.
-
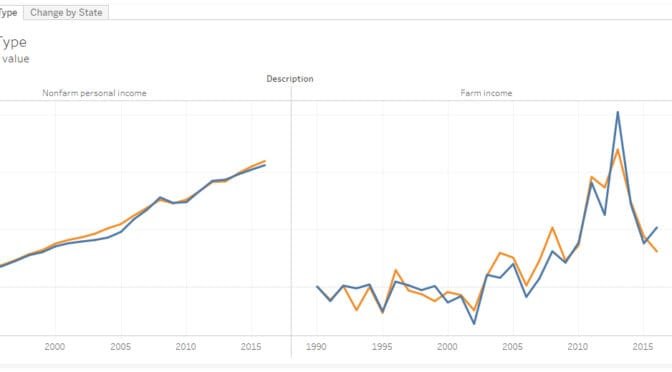
Kansas farm income
Comparing farm and non-farm income in Kansas and the Plains states.
-
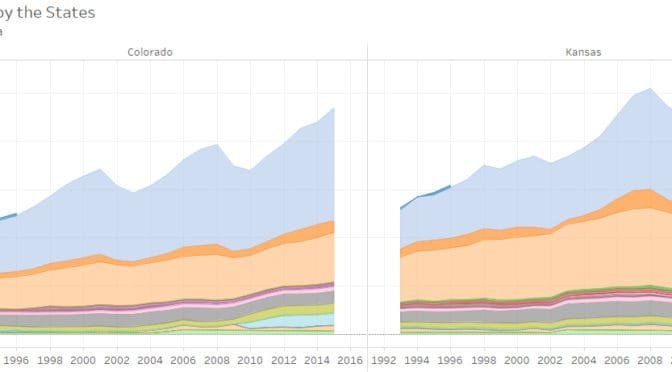
Tax collections by the states
An interactive visualization of tax collections by state governments.
-
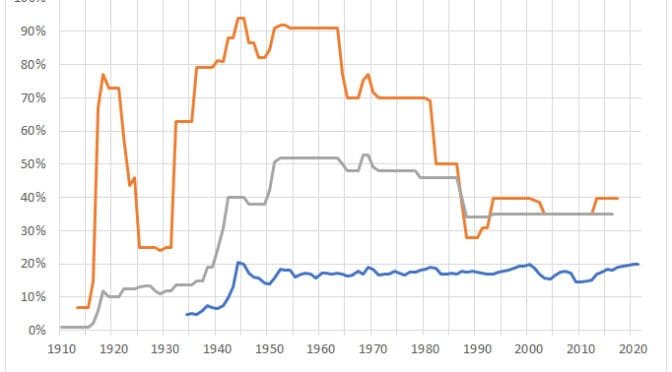
Tax rates and taxes paid
Is there a relationship between marginal tax rates and tax dollars collected?
-

Personal income in the states
An interactive visualization of income growth and change in the states, by major sector.
-

WichitaLiberty.TV: The regulatory and administrative state
Fred L. Smith, Jr. is the founder of the Competitive Enterprise Institute. He explains the problems with excessive regulation and a large administrative state.
-
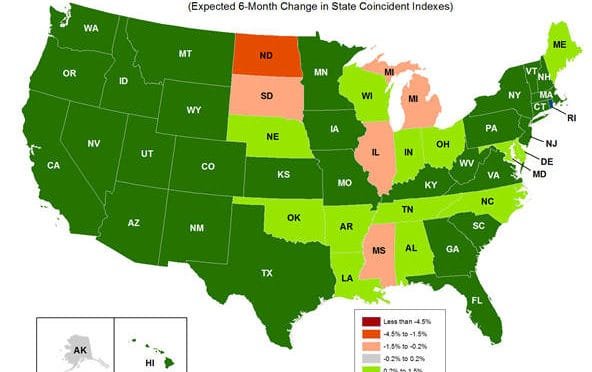
Economic indicators for the states
An index of past economic activity for each state, and another index looking forward.
-
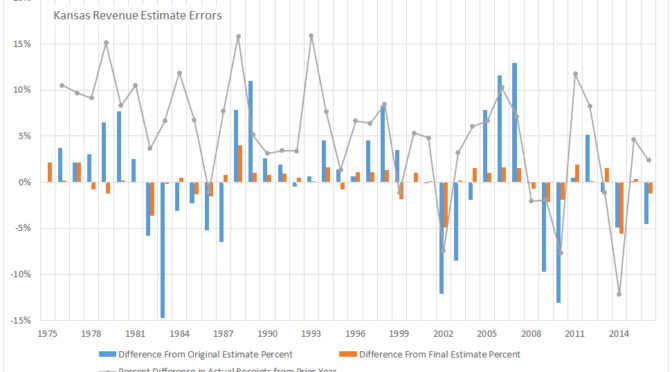
Kansas revenue estimates
Kansas revenue estimates are frequently in the news and have become a political issue. Here’s a look at them over the past decades.
-

Kansas manufacturing and oil not recovering
While total employment in Kansas is growing, two industries are the exception.