Tag: Economics
-
Are we winning the war on poverty?
Can we say we’re winning America’s war on poverty?
-

CBPP pushes political viewpoint as economic analysis
The Center on Budget & Policy Priorities (CBPP) is at it again, pushing their political viewpoint disguised as economic analysis, writes Dave Trabert of Kansas Policy Institute.
-

Wichita to consider tax abatements
Wichita considers three tax abatements, in one case forcing an “investment” on others that it itself would not accept.
-
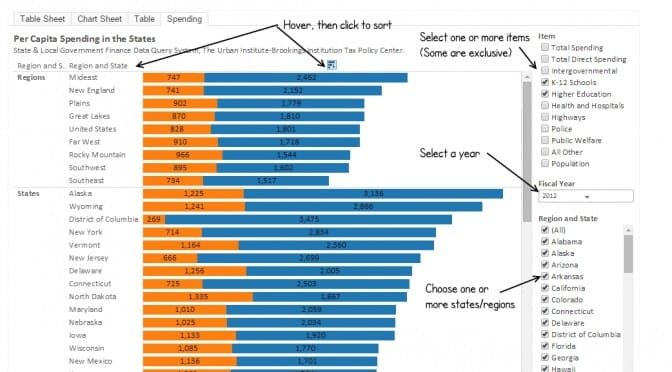
Spending in the states, per capita
An interactive visualization holding per-capita spending in several categories for each state.
-

In Depth with Walter Williams
This Sunday Dr. Walter E. Williams appeared on the C-SPAN program In Depth.
-

Kansas fiscal experiment
Those evaluating the Kansas fiscal “experiment” should consider what is the relevant input variable.
-

WichitaLiberty.TV: Wichita’s regulations and economic development
Do Wichita’s many laws and regulations accomplish their goals? Then, are Wichita’s economic development policies likely to work?
-
Entrepreneurship in Wichita
As Wichita seeks to reboot its spirit of entrepreneurship, we should make sure we do things that have a chance of working.
-

Video: Jeffrey Tucker, ‘Bit by Bit: How P2P Is Freeing the World’
Jeffrey A. Tucker, Director of Digital Development at the Foundation for Economic Education, talks about his new book, “Bit by Bit: How P2P Is Freeing the World” in this presentation at the Wichita Pachyderm Club.
-
WichitaLiberty.TV: Jeffrey Tucker and ‘Bit by Bit: How P2P Is Freeing the World’
Jeffrey Tucker talks about his most recent book “Bit by Bit: How P2P Is Freeing the World” and how Bitcoin and other distributed technologies are affecting the world.
-
State taxes and charitable giving
States with higher rates of economic growth grow total charitable giving at a faster rate than states with low rates of economic growth, finds a new report by American Legislative Exchange Council.
-

Kansas private nonfarm employment by county
An interactive visualization of private nonfarm employment in Kansas, for each county.