Tag: Economics
-
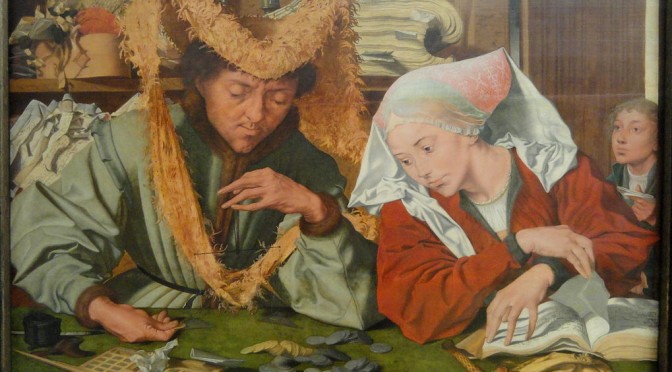
The candlemakers’ petition
The arguments presented in the following essay by Frederic Bastiat, written in 1845, are still in use in city halls, county courthouses, school district boardrooms, state capitals, and probably most prominently, Washington
-

Kansas sales tax has disproportionate harmful effects
Kansas legislative and executive leaders must realize that a shift to consumption taxes must be accompanied by relief from its disproportionate harm to low-income households.
-
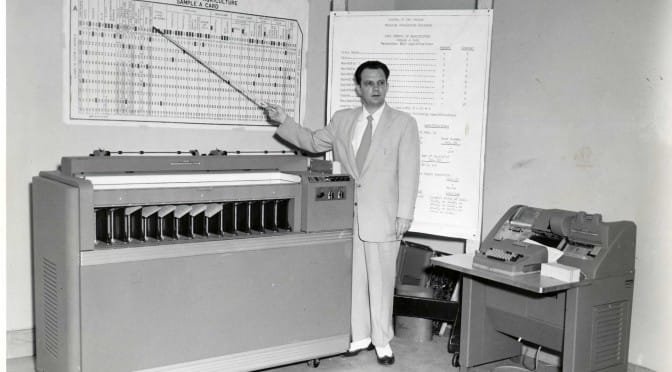
Tax rates and taxes paid
Those who call for a return to 90 percent tax rates should be aware that few people actually paid tax at those rates.
-
Economic freedom leads to better lives for all
Economic freedom, in countries where it is allowed to thrive, leads to better lives for people as measured in a variety of ways. This is true for everyone, especially for poor people.
-
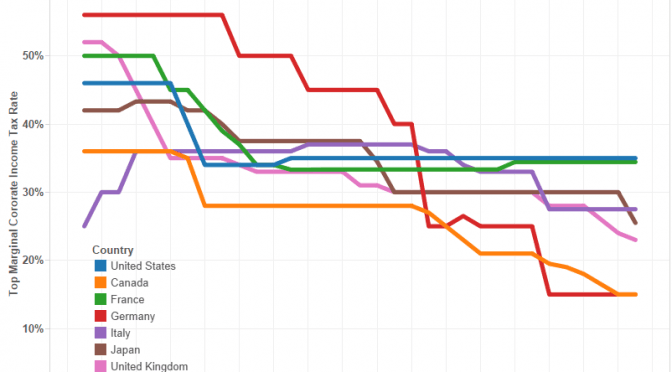
Corporate income tax rates in U.S. and other countries
Over the past two decades most large industrial countries have reduced their corporate income tax rates. Two countries, however, stand out from this trend: France and The United States.
-

With tax exemptions, what message does Wichita send to existing landlords?
As the City of Wichita prepares to grant special tax status to another new industrial building, existing landlords must be wondering why they struggle to stay in business when city hall sets up subsidized competitors with new buildings and a large cost advantage.
-

Taxation in the states
Examining tax collections by the states shows that Kansas collects more tax than many of our neighbors, and should put to rest some common myths.
-
Spending in the states, a visualization
An interactive visualization of state spending per person.
-

Kansas needs low taxes
Two research papers illustrate the need to maintain low taxes in Kansas, finding that high taxes are associated with reduced income and low economic growth.
-

Kansas cuts taxes and expands the economy
Ernie Goss is Professor of Economics at Creighton University and an expert on the Midwest economy. Following is his assessment of the Kansas economy in recent years.
-
In Kansas and Wichita, there’s a reason for slow growth
If we in Kansas and Wichita wonder why our economic growth is slow and our economic development programs don’t seem to be producing results, there is data to tell us why: Our tax rates are too high.
-
Kansas Center for Economic Growth: Show us the math
Why won’t Kansas Center for Economic Growth show its calculations and explain its data sources? Dave Trabert of Kansas Policy Institute explains.