Tag: Economics

  • Project Wichita, remember Visioneering Wichita

    Project Wichita, remember Visioneering Wichita

    As Project Wichita gets ready to gather information and set goals, let’s be aware that we’ve done this before, and not long ago.

    Project Wichita is a new initiative to do something about the future of Wichita. I hope it works. But we’ve been down this road before, and I don’t know of anything created that has been of lasting value.

    That past effort was Visioneering Wichita. I’d supply a link to its website, but the site went stale from lack of updates. Eventually it was abandoned, although its remnants may be found at archive.org. (Visioneering Wichita does have a Facebook page, although it hasn’t been updated for eight years.)

    Here’s one of the goals that Visioneering Wichita created for the city:

    Income Growth: The Wichita MSA must increase its focus on those non-manufacturing job sectors that generate higher pay. Since 2002, the Wichita per capita income as a percent of the United States per capita income has slowly increased, and in 2006 and 2007, the value exceeded 100%, for the first time since 1987.16 In spite of the recent uptick in Wichita’s per capita income as a percentage of the United States, it is expected that it will continue the longer term decline c until: a) the decline in manufacturing jobs stops b) the gap between the United States and Wichita in non-manufacturing earnings per job begins to decrease and c) the gap in minority income is decreased. 1

    Charts from Visioneering Wichita, May 2009. Click for larger.

    Per Capita Personal Income, Wichita and Visioneering Peers. Click for larger.
    I’ve gathered data on per capita personal income through 2016, the latest year for a full year of data, and prepared charts similar to those Visioneering used. Wichita per capita personal income continues to be lower than the cities identified as Visioneering peers, except for Oklahoma City. In fact, Wichita per capita personal income was lower in 2016 than in 2014.

    Wichita and United States Per Capita Personal Income. Click for larger.
    Comparing Wichita to the nation, we see that Wichita took a downturn the past few years.

    Personal Income, Wichita and Visioneering Peers. Click for larger.
    Per capita measures, while useful, are not without caveats that need to be understood and considered. For example, if half the people of Wichita moved to other cities, the per capita income would not change if the income of those who left was evenly distributed compared to the original distribution.

    Staff of the Visioneering Wichita project used to provide updates on these statistics from time to time. The last update provided to officials that I can recall was in 2013.

    Wichita civilian labor force through January 2018. Click for larger.
    Speaking of moving from Wichita, one of the things our region needs to address is the shrinking labor force. Data from the Bureau of Labor Statistics shows that the Wichita labor force is on the decline, while it is rising for the nation.

    Of the declining labor force, Wichita government and civic leaders use this in two different, and conflicting, ways. First, the declining labor force means that even though job growth is very low, the unemployment rate has dropped, and by a lot. This improved unemployment rate is trumpeted by politicians and bureaucrats. Second, we see concern that Wichita may not have the workers necessary to fill jobs in expanding companies like Spirit Aerosystems. This is used to promote increasing spending on incentives and training infrastructure.

    Wichita manufacturing jobs, through January 2018. Click for larger.
    By the way, the Visioneering report mentioned the decline in manufacturing jobs. The data shows that since the end of the Great Recession, the number of manufacturing jobs in the Wichita area is slowly declining, while rising for the nation at the same time.

    Perhaps the best thing Project Wichita could do is to reveal the truth about the Wichita economy and the economic development infrastructure we’ve built. The Chung Report has done a bit of this. But I don’t think our civic leaders act as through they know and understand. It is against their self-interest to admit that what they’ve done hasn’t been working.


    Notes

    1. Visioneering Wichita Revised Vision Document, May 2009.
  • Sorting and polarizing in America

    Sorting and polarizing in America

    American cities are changing with domestic migration. Kansas data excerpted.

    A new study looks at the characteristics of migrants in America — that is, individuals and families moving one city to another. 1 (“City” in this context means a consolidated statistical area, metropolitan statistical area, or micropolitan statistical area.)

    The author explains: “Domestic migration across U.S. metropolitan areas is selective: in-migrants to expensive metros tend to have higher incomes and educational attainment than out-migrants, while the opposite is true in the least expensive metros. This pattern contributes to the process of polarization across U.S. metros.”

    The data is fascinating. Consider the household income of in-migrants and out-migrants. For the Wichita CSA, the median household income of in-migrants is $36,998, and for out-migrants, $38,814. The difference is -$1,186. This doesn’t necessarily mean that Wichita is becoming poorer, as this data is only for households migrating to and from Wichita. (The figures are the average values for the years 2005 to 2016.)

    This result is not surprising, as the study notes a correlation between housing prices and a positive difference in migrant income. As Wichita has relatively low housing prices, a negative difference in migrant income is natural, according to the study data.

    The study supplies data for all areas in the nation. I’ve isolated data for Kansas and present it here. Where is Lawrence? It’s part of the Kansas City-Overland Park-Kansas City, MO-KS CSA.

    Click for pdf version.


    Notes

    1. Romem, Issi. Characteristics of Domestic Cross-Metropolitan Migrants. Available at https://www.buildzoom.com/blog/characteristics-of-domestic-cross-metropolitan-migrants.
  • Project Wichita right to look ahead at city’s future

    Project Wichita right to look ahead at city’s future

    We can understand self-serving politicians and bureaucrats. It’s what they do. But a city’s newspaper editorial board ought to be concerned with the truth.

    In February the Wichita Eagle editorialized about Project Wichita, a ramping-up effort to do something about the future of Wichita. 1 It’s worthwhile to take a look at the op-ed, if only to learn something about the quality of Wichita Eagle editorial writing.

    I understand civic boosterism; the desire to paint a positive image of the future. But this rosy outlook has to be based, at least loosely, on facts. Following, a look at a few claims made in the editorial.

    “Our downtown is becoming more of a destination and place to live.”
    The problem is this: Wichita economic development officials use a circuitous method of estimating the population of downtown Wichita, producing a number much higher than Census Bureau estimates. Downtown Wichita, the city’s economic development agency responsible for downtown, says the population of downtown is 2,138, which is far — really far — outside the range the Census Bureau gives. For more about this, see Living in downtown Wichita.

    As far as a destination for business, the U.S. Census Bureau tracks business trends by zip code. For zip code 67202, which is downtown Wichita, results since 2007 show fewer business establishments, fewer people working downtown, and lower earnings generated in downtown Wichita. In all cases, the trend is lower. For more about this, see Downtown Wichita business trends.

    Further, Wichita leaders have exaggerated the number of people working in downtown. For years our leaders told us there were 26,000 daytime workers in downtown Wichita. But this claim is based on misuse of data so blatant it can be described only as malpractice. In fact, this figure is now omitted from the state of downtown reports. No one will accept responsibility for this mistake. See Downtown Wichita jobs, sort of and Downtown Wichita report omits formerly prominent data.

    “But Wichita feels pretty good about itself, which suggests the community is at the perfect time to think about its future.”
    I have to say, we’ve been hoodwinked, and by our top leaders. Recently both the mayor of Wichita and chair of the county commission penned upbeat editorials praising our economy. See Mayor Longwell’s pep talk and Sedgwick County’s David Dennis on economic development.

    But the reality is quite different. See:

    Given this, why do the mayor, county commission chair, and our newspaper’s editorial board say what they do? The first two are politicians, but we ought to ask that our newspaper seek the truth, not personal political gain.

    “It will get more serious in March, when students and volunteers from Wichita State University’s Public Policy and Management Center …”
    This is the same organization on which the city relies for many services, including the gathering of public input in past campaigns like the 2014 sales tax election. The city seemed sure that tax would pass, but voters rejected it by a wide margin. 2

    “Public Policy director Misty Bruckner and her group will deliver feedback and conclusions to Project Wichita’s four co-chairs.”
    A few years ago Bruckner co-authored a paper titled “Citizen Attachment: Building Sustainable Communities.” 3 My reporting on it was titled Wichita needs more, and willing, taxpayers. An excerpt: “Increasingly, citizens are retreating from their responsibilities to community and demanding more from government than they are willing to pay for. But changes in local government behavior can be instrumental in reversing this trend, by strengthening citizens’ commitment to the well-being of their communities. Citizens who are committed to community are more willing to accept responsibility for the well-being of their fellow citizens and are also more likely to join with government and other parties to improve their communities. Citizens who are committed to community are also more willing taxpayers — that is, when government demonstrates that it can be trusted to invest public resources in ways that strengthen the community. The central thrust of this model is getting citizens and governments to work together, but realistically, many communities will require new revenue — including additional tax dollars — if they are to assemble the critical mass of resources necessary for meaningful change. Accordingly, citizens who are willing to pay increased taxes are an important component of building sustainable communities.” (emphasis added)

    Please don’t fault me for being cynical when I suspect that this entire operation is designed to prepare Wichitans (or the region) for a tax increase.

    “Community input will be as wide as the city limits.”
    Wait a moment. I thought we were supposed to think regionally.

    “Project Wichita seems similar to Visioneering Wichita …”
    I wonder if anyone remembers anything positive that resulted from Visioneering Wichita. After a few years, the organization’s website went stale, and staff discontinued making presentation to the city council and county commission See Visioneering asks for money. Let’s ask these questions.

    “Unlike Visioneering, Project Wichita isn’t headed by city or county government.”
    Visioneering Wichita was led by the Chamber of Commerce, not government. Local governments made financial contributions to Visioneering, just as they are also contributing to Project Wichita. 4


    Notes

    1. Wichita Eagle Editorial Board. Project Wichita right to look ahead at city’s future. Available at http://www.kansas.com/opinion/editorials/article198178899.html.
    2. Ryan, Kelsey. Voters soundly defeat Wichita sales tax proposal. Available at http://www.kansas.com/news/politics-government/election/article3567045.html.
    3. See http://www.gfoa.org/sites/default/files/GFR_OCT_10_24.pdf.
    4. Wichita Business Journal. Sedgwick County Commission approves Visioneering Wichita funding. Available at https://www.bizjournals.com/wichita/blog/2012/12/sedgwick-county-commission-approves.html.
  • WichitaLiberty.TV: Larry Reed, Foundation for Economic Education

    WichitaLiberty.TV: Larry Reed, Foundation for Economic Education

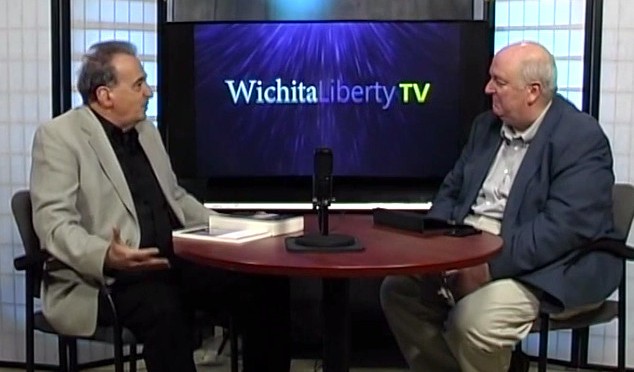
    In this episode of WichitaLiberty.TV: Lawrence W. Reed, President of Foundation for Economic Education, joins Bob and Karl to discuss the connection between liberty and character, our economic future, and I, Pencil. View below, or click here to view at YouTube. Episode 191, broadcast April 7, 2018.

    Shownotes

  • Wichita employment down, year-over-year

    Wichita employment down, year-over-year

    At a time Wichita leaders promote forward momentum in the Wichita economy, year-over-year employment has fallen.

    Today the Bureau of Labor Statistics released employment statistics through February 2018. 1

    One of the tables released is “Over-the-year change in total nonfarm employment for metropolitan areas, not seasonally adjusted,” which shows changes in jobs from February 2017 to February 2018. 2 For this time period for the Wichita metropolitan area, the number of nonfarm jobs fell from 294.7 thousand to 292.3 thousand, a decline of 2,400 jobs or 0.8 percent.

    In February, 313 metropolitan areas had over-the-year increases in nonfarm payroll employment, 69 had decreases, and 6 had no change.

    Over the same period, the unemployment rate in the Wichita MSA fell from 4.6 percent to 4.1 percent. The labor force fell from 309,336 to 304,886.


    Notes

    1. Bureau of Labor Statistics. Metropolitan Area Employment and Unemployment Summary. Available at https://www.bls.gov/news.release/metro.nr0.htm.
    2. Bureau of Labor Statistics. Over-the-year change in total nonfarm employment for metropolitan areas, not seasonally adjusted. Available at https://www.bls.gov/web/metro/metro_oty_change.htm.
  • Kansas highways set to crumble, foresees former budget director

    Kansas highways set to crumble, foresees former budget director

    Duane Goossen, former high Kansas government official, says the state’s highways are in trouble. What is his evidence?

    In a recent op-ed, Duane Goossen laments the lack of spending on Kansas roads and highways. 1 His focus is his claimed lack spending on maintenance, which, he says, will lead to much larger repair bills in the future.

    “But now the Kansas road system is truly threatened.” He raises the common “Bank of KDOT” criticism, writing “The highway fund became a convenient source of cash.”

    KDOT transfers from sales tax . Click for larger.
    It’s true, as Goossen writes, that a lot of money has been transferred from the highway fund to the general fund. At the same time, the amount of sales tax dollars transferred from the general fund to the transportation fund has risen, and by a factor of five over one decade.

    But it isn’t true that Kansas highways are crumbling from lack of spending on maintenance.

    Kansas Highway Conditions, through 2017. Click for larger.
    Here’s a chart of the conditions of Kansas roads and highways. 2 It shows that, for interstate highways, the percent of the system in good condition has been pretty level since 2001. For non-interstate highways, the percent in good condition fell starting in 2004, but has rebounded.

    Based on these charts, there’s no factual basis to claim that Kansas roads and highways are deteriorating.

    KDOT spending, major road programs. Click for larger.
    KDOT spending, total road programs. Click for larger.
    KDOT transfers. Click for larger.
    KDOT funding sources, partial. Click for larger.
    But Goossen looks to the future, claiming that a lack of spending now will lead to big bills later. Now, it’s important to know that while money has been transferred from the highway fund, that alone doesn’t tell us about the level of spending on maintenance. Looking at actual spending instead of transfers to and from, we find that for fiscal year 2017, spending on three categories (Maintenance, Preservation, and Modernization) was nearly unchanged from the year before, while spending on the category Expansion and Enhancement fell by 31 percent.

    For these four categories — which represent the major share of KDOT spending on roads — spending in fiscal 2017 totaled $738.798 million. That’s down 14 percent from $857.133 million the year before, and up from a low of $698.770 million in fiscal 2010. 3

    And adjusted for inflation, spending on maintenance programs has declined somewhat, including in the years when Goossen held high office. These declines, however, are far short of setting up Goossen’s prediction of calamity.

    Then, there’s this, which is really incredible. Goossen criticizes some of the bonds issued by KDOT in recent years, and he is on the mark: “And a portion of that debt has ‘interest only’ payments in the first years, with the principal payments still to come.”

    However: The state also issued “interest only” bonds in 2004 and 2010. 4 Who was budget director during these years, as well as Secretary of the Kansas Department of Administration? Duane Goossen. 5 But now Goossen criticizes as irresponsible the same action the state took when he was in high office.

    Given the insufficient factual basis for Goossen’s claims — not to mention the blatant hypocrisy — we have to wonder if this article is politically motivated. Perhaps it is, as we see Goossen making the maximum allowed contribution to Kansas Democratic gubernatorial candidate Laura Kelly.

    Either that, or Goossen is auditioning for another government job.


    Notes

    1. Goossen, Duane. Trouble coming for Kansas highways. Garden City Telegram, March 30, 2018. Available at http://www.gctelegram.com/opinion/20180330/trouble-coming-for-kansas-highways.
    2. Kansas Department of Transportation. 2017 Kansas NOS Condition Survey Report. Available at https://www.ksdot.org/Assets/wwwksdotorg/bureaus/matResLab/pmis/2017/CSR2017_SW.pdf.
    3. Weeks, Bob. Kansas highway spending. Available at https://wichitaliberty.org/kansas-government/kansas-highway-spending-2017/.
    4. Weeks, Bob. Kansas transportation bonds economics worse than told. Available at https://wichitaliberty.org/kansas-government/kansas-transportation-bonds-economics-worse-than-told/.
    5. Goossen, Duane. Kansas Budget blog. Available at http://www.kansasbudget.com/.
  • WichitaLiberty.TV: Dr. Wolf von Laer of Students for Liberty

    WichitaLiberty.TV: Dr. Wolf von Laer of Students for Liberty

    In this episode of WichitaLiberty.TV: Dr. Wolf von Laer of Students for Liberty joins Bob and Karl to talk about young people and the cause of liberty. View below, or click here to view at YouTube. Episode 190, broadcast March 31, 2018.

    Shownotes

  • WichitaLiberty.TV: Dr. Tom G. Palmer and the causes of wealth

    WichitaLiberty.TV: Dr. Tom G. Palmer and the causes of wealth

    In this episode of WichitaLiberty.TV: Dr. Tom G. Palmer of Atlas Network joins Bob Weeks to explain why the usual approach to foreign aid isn’t working, and what Atlas Network is doing to change the lives of the poor across the world. View below, or click here to view at YouTube. Episode 189, broadcast March 24, 2018.

    Shownotes

  • Kansas personal income

    Kansas personal income

    Personal income in Kansas rose in 2017 at a rate one-third that of the nation.

    Personal income in Kansas for 2017 was $138,673 million, according to preliminary estimates released today by the Bureau of Economic Analysis, an agency of the United States Department of Commerce.

    Change in personal income, 2016 to 2017. Click for a larger version and the BEA press release.
    That is an increase of 1.0 percent from 2016, when personal income was $137,305 million. These are current dollars, not adjusted for inflation. 1

    The growth for Kansas — 1.0 percent — ranked 47th among the states. For the nation, personal income rose by 3.1 percent, and for the Plains states, it rose by 1.7 percent.

    BEA gives the population of Kansas as 2,913,000, with per capita personal income at $47,603. That ranks 24th among the states, and is 94 percent of the value of personal income for the entire nation, which is $50,392.

    Personal income, according to BEA, is “the income received by, or on behalf of, all persons from all sources: from participation as laborers in production, from owning a home or business, from the ownership of financial assets, and from government and business in the form of transfers. It includes income from domestic sources as well as the rest of world. It does not include realized or unrealized capital gains or losses.” 2

    For Kansas, there were these notable changes in earnings:
    Farm: Down by 0.66 percent
    Non-durable goods manufacturing: Up by 0.23 percent
    Wholesale trade: Up by 0.11 percent
    Transportation and warehousing: Up by 0.15 percent
    Management of companies and enterprise: Up by 0.15 percent
    Health care and social assistance: Up by 0.23 percent
    State and local government: Up by 0.21 percent


    Notes

    1. Bureau of Economic Analysis. State Personal Income: 2017. Available at https://www.bea.gov/newsreleases/regional/spi/sqpi_newsrelease.htm.
    2. Ibid.