Tag: Economics
-

Kansas economy has been underperforming
Those who call for a return to the economic policies of past Kansas gubernatorial administrations may not be aware of the performance of the Kansas economy during those times.
-
WichitaLiberty.TV: Economist Art Hall on Wichita’s water and economic development
Economist Dr. Art Hall of the Center for Applied Economics at The University of Kansas talks about issues relevant to the proposed Wichita sales tax, particularly water and economic development.
-

Video: ‘Wealth of States’ presented in Wichita
Heritage Foundation Chief Economist Stephen Moore spoke to a luncheon gathering at the Wichita Pachyderm Club about his new book, “An Inquiry into the Nature and Causes of the Wealth of States.”
-
Is Kansas a rural, agriculture state?
One of the most-often repeated themes heard during the Kansas Governor debate at the Kansas State Fair is that Kansas is a rural state, and that agriculture is vital to our state’s economy.
-
Labor unions have harmed our standard of living
labor unions reduce the supply and productivity of labor and so reduce the supply and raise the prices of the goods and services their members help to produce, thereby reducing real wages throughout the economic system, writes George Reisman.
-

Wichita arena sales tax not a model of success
Supporters of a new sales tax in Wichita use the Intrust Bank Arena as an example of successful application of a sales tax.
-

Employment in the states
There are dueling claims and controversy over employment figures in Kansas and our state’s performance relative to others. I present the actual data in tables and interactive visualizations that you can use to make up your own mind.
-

Quarterly state GDP data released
A new series of GDP data shows government growing faster in Kansas than in most states, with private sector growth near the middle of the states.
-
Growth of GDP in the states
An interactive visualization of the growth of gross domestic product in the states and regions.
-
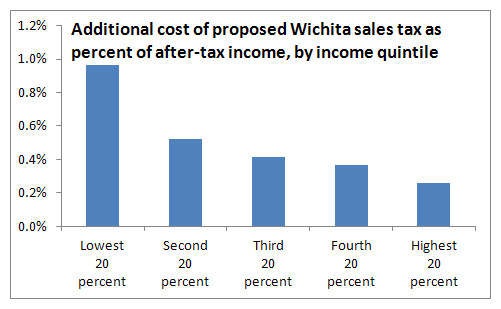
Wichita sales tax hike would hit low income families hardest
Analysis of household expenditure data shows that a proposed sales tax in Wichita affects low income families in greatest proportion, confirming the regressive nature of sales taxes.
-
An evaluation of the Kansas affordable airfares program
An evaluation of the Kansas affordable airfares program. Prepared for the Kansas Department of Commerce by Arthur P. Hall, Ph.D., Executive Director Center for Applied Economics, School of Business, University of Kansas. February 2013.
-

Charles Koch: How to really turn the economy around
Charles Koch offers insight into why our economy is sluggish, and how to make a positive change.