Tag: Economics
-

Competition in markets
Competition must surely be one of the most misunderstood concepts. As applied to economics, government, and markets, the benefits of competition are not understood and valued.
-
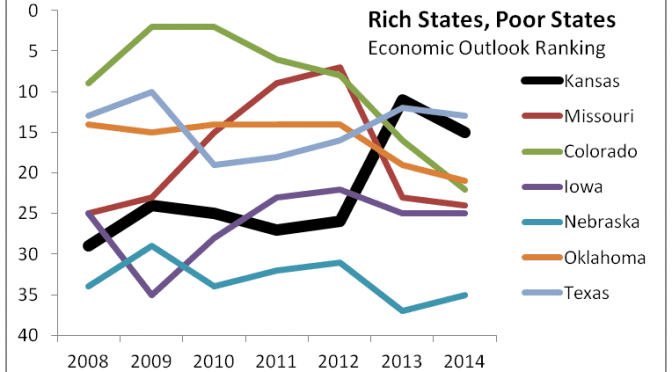
Rich States, Poor States for 2014 released
In the 2014 edition of Rich States, Poor States, Kansas continues with middle-of-the-pack performance rankings, and fell in the forward-looking forecast.
-

WichitaLiberty.TV: Schools and the nature of competition and cooperation, Wind power and taxes
A Kansas newspaper editorial is terribly confused about schools and the nature of competition in markets. Then, we already knew that the wind power industry in Kansas enjoys tax credits and mandates. Now we learn that the industry largely escapes paying property taxes.
-
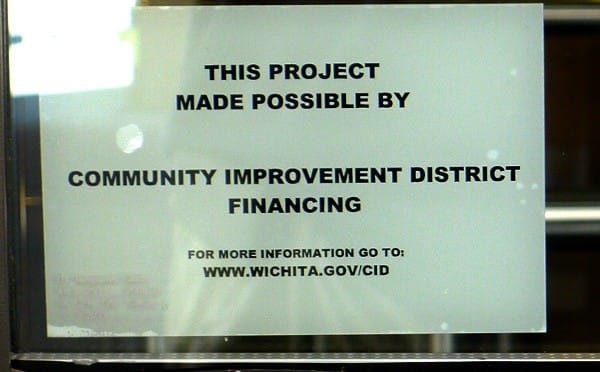
Wichita City Council fails to support informing the taxed
What does it say about Wichita’s economic development strategy that if you fully inform citizens and visitors, it renders a tool useless?
-
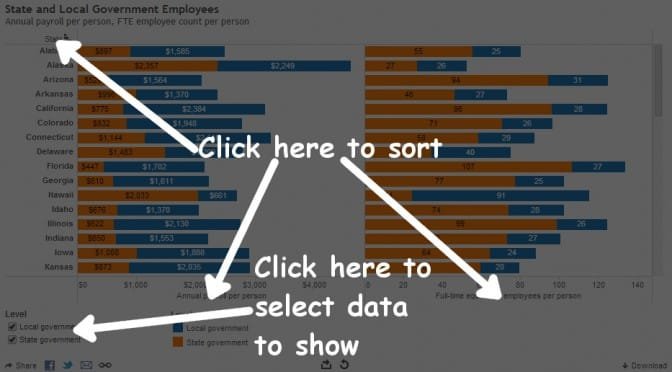
State and local government employment levels vary
The states vary widely in levels of state government and local government employees, calculated on a per-person basis.
-

State employment visualizations
There’s been dueling claims and controversy over employment figures in Kansas and our state’s performance relative to others. I present the actual data in interactive visualizations that you can use to make up your own mind.
-
Recommended reading: Foundations of a Free Society
Described as “An introduction to the core principles that define a free society,” I highly recommend this short book.
-
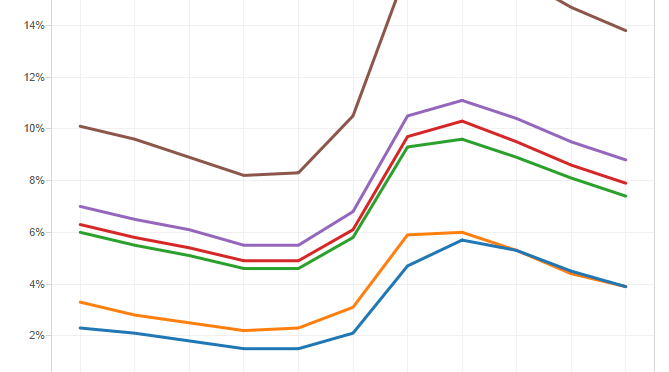
Alternative measures of unemployment
Besides the official unemployment rate that is the topic of news each month, the Bureau of Labor Statisticstracks and publishes five other series
-
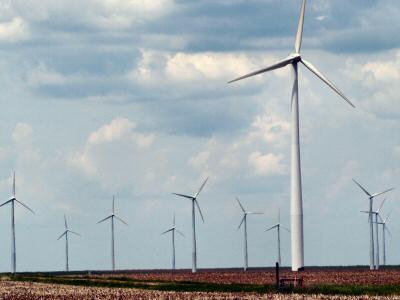
Special interests defend wind subsidies at taxpayer cost
The spurious arguments made in support of the wind production tax credit shows just how difficult it is to replace cronyism with economic freedom.
-
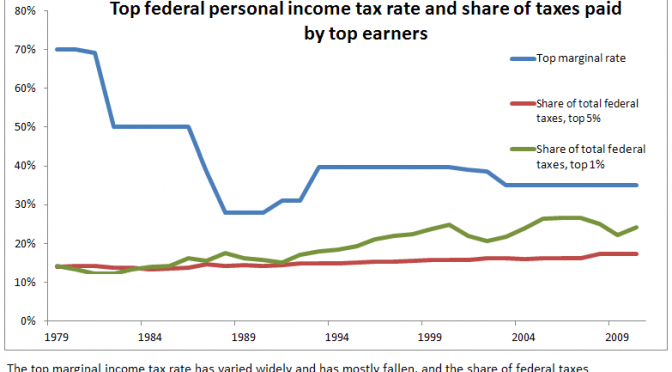
The relevance of income tax rates
Data shows that high tax rates on top earners doesn’t mean that they actually pay taxes at correspondingly higher rates.
-
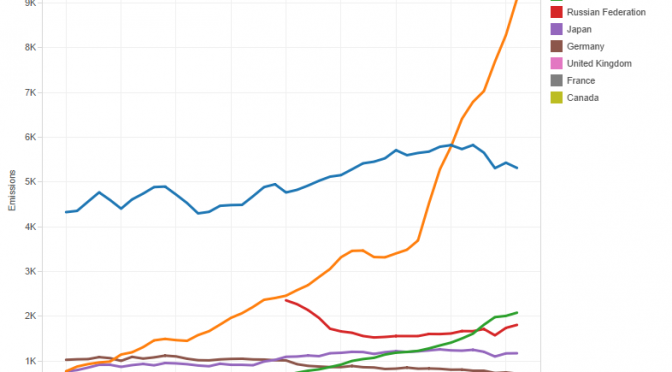
American economy is more competitive and carbon-efficient, says economist
The oil and gas boom in America boosts our competitiveness in the world economy while at the same time reducing carbon emissions, says economist Stephen Moore.
-
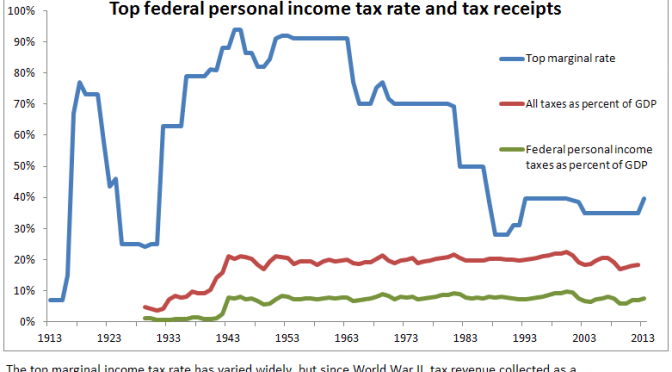
The purpose of high tax rates on the rich
The purpose of high taxes on the rich is not to get the rich to pay money, it’s to get the middle class to feel better about paying high taxes.