Tag: Featured
-

Kansas sales tax reform: Revenue booster?
Kansas has a problem with sales tax exemptions, but the potential revenue boost from reform is not as great as commonly mentioned, unless Kansas wants to place its manufacturers at severe disadvantage.
-

‘Transforming Wichita’ a reminder of the value of government promises
When Wichita voters weigh the plausibility of the city’s plans for spending proposed new sales tax revenue, they should remember this is not the first time the city has promised results and accountability.
-

Wichita planning results in delay, waste
Wichita plans an ambitious road project that turns out to be too expensive, resulting in continued delays for Wichita drivers and purchases of land that may not be needed.
-

Wichita arena sales tax not a model of success
Supporters of a new sales tax in Wichita use the Intrust Bank Arena as an example of successful application of a sales tax.
-

When Wichita officials promise to look out for your interests, remember last summer
When the City of Wichita tells citizens that it will thoroughly investigate and vet potential economic development projects and partners, remember what the city did just last summer.
-
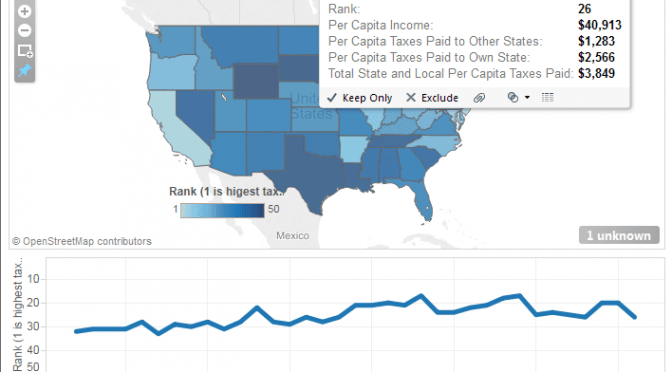
State and local tax burdens presented
An interactive visualization lets you see the tax burden for residents in any state, and see how the state’s rank has changed over time.
-

Employment in the states
There are dueling claims and controversy over employment figures in Kansas and our state’s performance relative to others. I present the actual data in tables and interactive visualizations that you can use to make up your own mind.
-

Voice for Liberty Radio: Kansas Secretary of Revenue Nick Jordan
Nick Jordan is Secretary of Revenue for the State of Kansas. He spoke to the Wichita Pachyderm Club on the topic “An Analysis of Governor Brownback’s Tax Policy” on August 22, 2014.
-

Kansas campaign material repository
An accessible collection of campaign material will help hold candidates and campaigns accountable.
-

Your smartphone is your activism toolkit
Your smartphone is a valuable tool for activism. Here are two ways to get involved.
-
WichitaLiberty.TV: Wichita’s missing water, sales tax, Gidget, smartphone activism
A former Wichita mayor wonders what happened to Wichita’s water supply. Then, meet Gidget, a Kansas blogger I think you will enjoy. Finally, how can you use your smartphone to help candidates and causes?
-

Kansas school claims, numbers don’t match
Kansas school spending advocates make claims of exploding class sizes that aren’t reflected in enrollment and employment data