Tag: Featured

  • In Kansas, a lost legislative opportunity

    In Kansas, a lost legislative opportunity

    Kansas legislators are struggling to balance the state’s budget. In 2012 the legislature passed a tax cut, although it was unevenly applied. But in the intervening years, the legislature has not taken serious steps to cut state spending to match. Legislators failed to consider bills to streamline and outsource government functions, although the bills had passed in a previous session. The legislature has also failed to consider budgetary process reform as explained below in an article from May 2012.

    Leaders in the Kansas legislature and executive branch tell us the only way to balance the Kansas budget this year is by raising more revenue through taxation. That may be true, as reforming spending and budgeting takes time to accomplish. We had the time. But our legislature and executive branch squandered that opportunity. Now, they ask you for more tax revenue.

    This year Kansas made a leap forward in reducing income tax rates. The next step for Kansas is to reduce its spending, both to match the reduced revenue that is forecast, but also to improve the efficiency of Kansas government and leave more money in the hands of the private sector. Specifically, Kansas needs to improve its budgeting process and streamline state government.

    In Kansas, like in many states, the budgeting process starts with the previous year’s spending. That is then adjusted for factors like inflation, caseloads, and policy changes that necessitate more (or rarely, less) spending. The result is that debates are waged over the increment in spending. Rarely is the base looked at to see if the spending is efficient, effective, or needed.

    There are several approaches Kansas could take to improve on this process. One is zero-based budgeting. In this approach, an agency’s budget set to zero. Then, every spending proposal must have a rationale or justification for it to be added to the budget.

    Zero-based budgeting can be successful, but, according to the recent paper Zero-base Budgeting in the States from National Conference of State Legislatures, it requires a large commitment from the parties involved. It also can take a lot of time and resources. Kansas could start the process with just a few agencies, and each agency could go through the process periodically, say once every five or six years. Some states have abandoned the zero-based budgeting process.

    In its State Budget Reform Toolkit, American Legislative Exchange Council advocates a system called priority-based budgeting. This process starts with deciding on the core functions of state government. That, of course, can be a battle, as people have different ideas on what government should be doing.

    ALEC reports that “In 2003, Washington state actually implemented priority based budgeting to close a budget deficit of $2.4 billion without raising taxes.”

    The spending cuts Kansas needs to balance the budget are not large. Kansas Policy Institute has calculated that a one-time cut of 6.5 percent next year would be sufficient to bring the budget to balance.

    The problem that Kansas will face in reducing state spending and streamlining its government is that there are those who are opposed. Streamlining often means eliminating programs that aren’t needed, aren’t performing as expected, or are very costly. These programs, however, all have constituencies that benefit from them — the concept of concentrated benefits and dispersed costs that public choice economics has taught us. These constituencies will be sure to let everyone know how harmful it will be to them if a program is scaled back or ended.

    Streamlining also means that there may be fewer state employees. Some will say that the loss of state employees means a loss for the economy, as the state workers will no longer be receiving a paycheck and spending it. This reasoning, however, ignores the source of state workers’ pay: the taxpayers of Kansas. With fewer state employees, taxpayers will have more money to spend or invest. The problem is that it is easier to focus on the employees that may lose their jobs, as they are highly visible and they have vocal advocacy groups to watch out for them. This is an example of the seen and unseen, as explained by Henry Hazlitt.


  • WichitaLiberty.TV: Wichita economic development, Kansas schools and spending, minimum wage

    WichitaLiberty.TV: Wichita economic development, Kansas schools and spending, minimum wage

    In this episode of WichitaLiberty.TV: Can we reform economic development in Wichita to give us the growth we need? Kansas school test scores, school spending, and how the Wichita district spends your money. Then, who is helped by raising the minimum wage? View below, or click here to view at YouTube. Episode 84, broadcast May 10, 2015.

  • Kansas school employees, the trend

    Kansas school employees, the trend

    The trend in Kansas public school employment and teacher/pupil ratios may surprise you, given the narrative presented by public schools.

    “More students, but fewer teachers — Since 2009, Kansas schools have gained more than 19,000 students but have 665 fewer teachers.” (Quality at Risk: Impact of Education Cuts, Kansas Center for Economic Growth)

    “Class sizes have increased, teachers and staff members have been laid off.” (What’s the Matter With Kansas’ Schools?, New York Times)

    This is typical of the sentiment in Kansas — that there are fewer teachers since Sam Brownback became governor, and that class sizes have exploded.

    Kansas school enrollment and employment data. Click for the interactive visualization of this data.
    Kansas school enrollment and employment data. Click for the interactive visualization of this data.
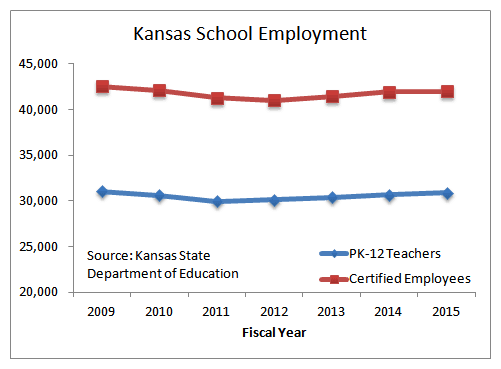
    Below is a chart of data from Kansas State Department of Education. This data shows that for the past four years employment is rising, both for teachers and certified employees. Also, the ratio of these employees to students is falling, meaning fewer pupils per employee.

    Class size is not the same as pupil-teacher ratio. But if there are proportionally more teachers than students, we have to wonder why class sizes are growing. What are the teachers doing?

    The story is not the same in each school district. I’ve created an interactive visualization that lets you examine the employment levels and ratios in individual Kansas school districts. Click here to open the visualization in a new window.

    Kansas School Enrollment and Employment
    Kansas School Enrollment and Employment
    Kansas School Employment
    Kansas School Employment
    Kansas School Pupil-Teacher Ratio
    Kansas School Pupil-Teacher Ratio
  • Wichita area job growth

    Wichita area job growth

    Private sector job growth in the Wichita area is improving, but lags behind local government employment growth.

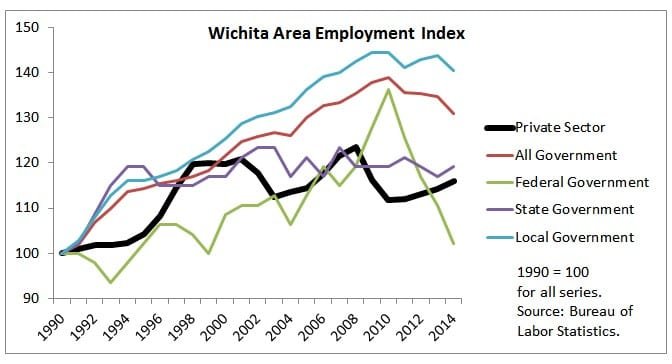
    Data from the Bureau of Labor Statistics through 2014 allows us to compare trends of employment in the Wichita metropolitan area. Over the past few years we see private sector employment rising. At the same time government employment, particularly state and local government employment, has declined or leveled.

    Wichita area employment. Click for larger version.
    Wichita area employment. Click for larger version.
    Over the 24 years covered by the chart, private sector employment grew by 16 percent. Local government employment grew by 41 percent.

    This long-term trend is a problem. It is the private sector that generates the taxes that pay for government. When government grows faster than the private sector, economic activity is shifted away from productive activities to unproductive. The economist Dan Mitchell has proposed what he calls the “Golden Rule of Fiscal Policy,” which is: “The Private Sector should Grow Faster than Government.” This is not happening in the Wichita metropolitan area.

  • Wichita property tax rates up again

    Wichita property tax rates up again

    The City of Wichita says that it hasn’t raised its mill levy in many years. Data shows the mill levy has risen, and its use has shifted from debt service to current consumption.

    Wichita mill levy rates. This table holds only the taxes levied by the City of Wichita and not any overlapping jurisdictions.
    Wichita mill levy rates. This table holds only the taxes levied by the City of Wichita and not any overlapping jurisdictions.
    In 1994 the City of Wichita mill levy rate was 31.290. In 2014 it was 32.652, based on the city’s Comprehensive Annual Financial Report and the Sedgwick County Clerk. That’s an increase of 1.362 mills, or 4.35 percent, since 1994. (These are for taxes levied by the City of Wichita only, and do not include any overlapping jurisdictions.)

    The Wichita City Council did not take explicit action to raise this rate. Instead, the rate is set by the county based on the city’s budgeted spending and the assessed value of taxable property subject to Wichita taxation.

    Wichita mill levy rates. Click for larger version.
    Wichita mill levy rates. Click for larger version.
    While the city doesn’t have control over the assessed value of property, it does have control over the amount it decides to spend.

    Change in Wichita mill levy rates, year-to-year and cumulative. Click for larger version.
    Change in Wichita mill levy rates, year-to-year and cumulative. Click for larger version.
    Also, while some may argue that an increase of 4.35 percent over two decades is not very much, this is an increase in a rate of taxation, not actual tax revenue. The revenue collected is a function of the mill levy rate multiplied by the value of taxable property. Revenue has risen, due both to appreciation in the value of property and an increase in the amount of property.

    Application of tax revenue has shifted

    The allocation of city property tax revenue has shifted over the years. According to the 2010 City Manager’s Policy Message, page CM-2, “One mill of property tax revenue will be shifted from the Debt Service Fund to the General Fund. In 2011 and 2012, one mill of property tax will be shifted to the General Fund to provide supplemental financing. The shift will last two years, and in 2013, one mill will be shifted back to the Debt Service Fund. The additional millage will provide a combined $5 million for economic development opportunities.”

    Wichita mill levy, percent dedicated to debt service. Click for larger version.
    Wichita mill levy, percent dedicated to debt service. Click for larger version.
    In 2005 the mill levy dedicated to debt service was 10.022. In 2014 it was 8.537. That’s a reduction of 1.485 mills (14.8 percent) of property tax revenue dedicated for paying off debt. Another interpretation of this is that in 2005, 31.4 percent of Wichita property tax revenue was dedicated to debt service. In 2014 it was 26.1 percent.

    This shift has not caused the city to delay paying off debt. This city is making its scheduled payments. But we should recognize that property tax revenue that could have been used to retire debt has instead been shifted to support current spending. Instead of spending this money on current consumption — including economic development spending that has produced little result — we could have, for example, used that money to purchase some of our outstanding bonds.

    Despite the data that is readily available in the city’s comprehensive annual financial reports, some choose to remain misinformed and/or uninformed. The video below provides insight into the level of knowledge of some elected officials and city staff.

  • Kansas and U.S. economic dashboard

    Kansas and U.S. economic dashboard

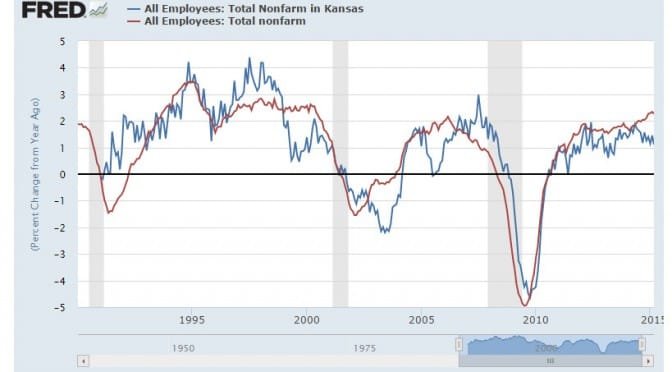
    FREDS exampleHere is a collection of charts comparing aspects of Kansas and its economy to the United States. These charts are from the Federal Reserve Bank of St. Louis, which gathers the data from a variety of sources. The graphs are interactive in a variety of ways and should always be current with the most recent data.

    Click here to view the charts.

  • Wichita economic development, the need for reform

    Wichita economic development, the need for reform

    An incentives deal for a Wichita company illustrates a capacity problem and the need for reform.

    Next week the Wichita City Council will consider an economic development incentives package intended to enable a local manufacturing company to expand its operations.

    R and R Aerospace benefits 2015-05-05City documents give some detail regarding the amounts of property tax to be forgiven on an annual basis, for a period of up to ten years. In the past, city documents have often mentioned other incentive programs that will benefit the company, but that information is missing. Other sources mention two state programs — PEAK and HPIP — the company may benefit from, but amounts are not available.

    In order to prepare the incentives package, several events took place. There was a visit to the company. Then another visit and tour. Then economic development officials helped the company apply for benefits from the Kansas Department of Commerce. Then these officials worked closely with Wichita city staff on an incentive package.

    City documents state that the expansion will create 28 jobs over the next five years. Obtaining these jobs took a lot of effort from Wichita and Kansas economic development machinery. Multiple agencies and fleets of bureaucrats at GWEDC, the City of Wichita, Sedgwick County, and the State of Kansas were involved. Wichita State University had to be involved. All this to create 5.6 jobs per year for five years.

    The jobs are welcome. But this incident and many others like it reveal a capacity problem, which is this: We probably need to be creating 5.6 jobs every working hour of every day in order to make any significant progress in economic growth. If it takes this much effort to create 28 jobs over five years, how much effort will it take to create the many thousands of jobs we need to create every year?

    This assumes, of course, that the incentives are necessary to enable the company to expand. City documents state that the tax exemption is necessary to make the project “viable.” It’s likely that the mayor or city council members will say that if we don’t award the incentives, the company won’t be able to expand. Or perhaps the company will expand in some other city. So the incentives really don’t have any cost, they will tell citizens.

    This only hints at a larger problem. If companies can’t afford to make investments in Wichita unless they receive exemptions from paying taxes, we must conclude that taxes are too high. (An ongoing study reveals that generally, property taxes on commercial and industrial property in Wichita are high. In particular, taxes on commercial property in Wichita are among the highest in the nation. See here.) It’s either that, or this company simply doesn’t want to participate in paying for the cost of government like most other companies and people do.

    To top it off, this expansion and the new jobs seem far from certain. City documents state the company is “bidding on a new work package” and the “expansion project would be completed in phases
    based upon the timing and demand of the work package.”

    Civic leaders say that our economic development policies must be reformed. So far that isn’t happening. Our leaders say that cash incentives are on the way out. This deal does not include grants of cash, that is true. But forgiveness of taxes is more valuable to business firms than receiving cash. That’s because cash incentives are usually taxable as income, while forgiveness of taxes does not create taxable income. Each dollar of tax that is forgiven adds one dollar to after-tax profits. 1

    The large amount of bureaucratic effort and cost spent to obtain a small number of speculative jobs lets us know that we need to do something else in order to grow our local economy. We need to create a dynamic economy, focusing our efforts on creating an environment where growth can occur organically without management by government. Dr. Art Hall’s paper
    Embracing Dynamism: The Next Phase in Kansas Economic Development Policy provides much more information on the need for this.

    Another thing we can do to help organically grow our economy and jobs is to reform our local regulatory regime. Recently Kansas Policy Institute released a study of regulation and its impact at the state and local level. This is different from most investigations of regulation, as they usually focus on regulation at the federal level.

    Business Perceptions of the Economic Impact of State and Local Government Regulation coverThe study is titled “Business Perceptions of the Economic Impact of State and Local Government Regulation.” It was conducted by the Hugo Wall School of Public Affairs at Wichita State University. Click here to view the entire document.

    Following is an excerpt from the introduction by James Franko, Vice President and Policy Director at Kansas Policy Institute. It points to a path forward.

    Surprising to some, the businesses interviewed did not have as much of a problem with the regulations themselves, or the need for regulations, but with their application and enforcement. Across industries and focus group sessions the key themes were clear — give businesses transparency in what regulations are being applied, how they are employed, provide flexibility in meeting those goals, and allow an opportunity for compliance.

    Sometimes things can be said so often as to lose their punch and become little more than the platitudes referenced above. The findings from Hugo Wall are clear that businesses will adapt and comply with regulations if they are transparent and accountable. Many in the public can be forgiven for thinking this was already the case. Thankfully, local and state governments can ensure this happens with minimal additional expense.

    A transparent and accountable regulatory regime should be considered the “low hanging fruit” of government. Individuals and communities will always land on different places along the continuum of appropriate regulation. And, a give and take will always exist between regulators and the regulated. Those two truisms, however, should do nothing to undermine the need for regulations to be applied equally, based on clear rules and interpretations, and to give each business an opportunity to comply. (emphasis added)

    Creating a dynamic economy and a reformed regulatory regime should cost very little. The benefits would apply to all companies — large or small, startup or established, local or relocations, in any industry.

    Our civic leaders say that our economic development efforts must be reformed. Will the path forward be a dynamic economy and reformed regulation? Or will it be more bureaucracy, chasing five jobs at a time?

    1. Site Selection magazine, September 2009. 2015. ‘INCENTIVES — Site Selection Magazine, September 2009’. Siteselection.Com. Accessed May 1 2015. http://www.siteselection.com/issues/2009/sep/Incentives/
  • WichitaLiberty.TV: Kansas revenue and spending, initiative and referendum, and rebuliding liberty

    WichitaLiberty.TV: Kansas revenue and spending, initiative and referendum, and rebuliding liberty

    In this episode of WichitaLiberty.TV: The Kansas Legislature appears ready to raise taxes instead of reforming spending. Wichita voters have used initiative and referendum, but voters can’t use it at the state level. A look at a new book “By the People: Rebuilding Liberty Without Permission.” View below, or click here to view at YouTube. Episode 83, broadcast May 3, 2015.

  • Kansas school test scores, an untold story

    Kansas school test scores, an untold story

    If the Kansas public school establishment wants to present an accurate assessment of Kansas schools, it should start with its presentation of NAEP scores.

    Kansas public school leaders are proud of Kansas schools, partly because of scores on the National Assessment of Educational Progress (NAEP), known as “The Nation’s Report Card.” Kansas ranks high among the states on this test. It’s important, however, to examine the results from a few different angles to make sure we understand the entire situation.

    I’ve gathered scores from the 2013 administration of the test, which is the most recent data available. I present data in an interactive visualization that you may use through the links at the end of this article. The most widely available NAEP data is for two subjects: reading and math, and for two grades, fourth and eighth. In the nearby images captured from the visualizations, I present data for Kansas and the average for national public schools. I’ve also added Texas and Florida, as schools in those states have sometimes been mentioned in comparisons to Kansas. The numbers in the charts are the percent of students that score at or above proficient.

    NAEP scores grouped by ethnicity. Click for larger version.
    NAEP scores grouped by ethnicity. Click for larger version.

    Considering all students, Kansas has the best scores for all combinations of grade levels and subjects, except for one.

    When we compare black students only, we find Kansas outperformed by Texas in all cases. National public schools beat Kansas in one case, and tie in another.

    Looking at Hispanic students only, Florida beats Kansas in three cases and ties in one. In some cases the difference is large.

    Looking at white students only, Texas outperforms Kansas in all cases. National public schools score higher than Kansas in three of four cases.

    Another way to look at test scores is to group students by eligibility for free or reduced school lunches. This is a widely used surrogate for family income. In this analysis Kansas performs better in comparison to other states, but Kansas is not always the best.

    NAEP scores grouped by free/reduced lunch eligibility. Click for larger version.
    NAEP scores grouped by free/reduced lunch eligibility. Click for larger version.

    These visualizations are interactive, meaning that you may adjust parameters yourself. For the visualization grouping students by ethnicity, click here. For the visualization grouping students by school lunch eligibility, click here.