Tag: Featured
-

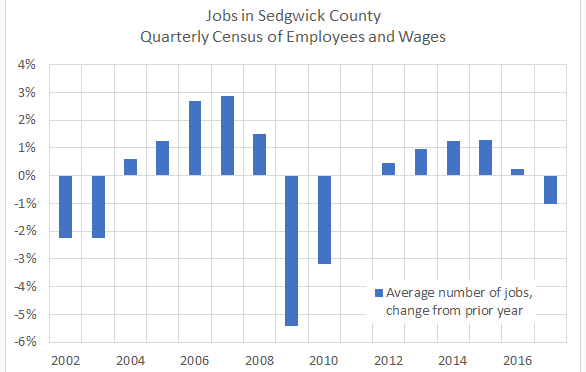
Wichita employment down, year-over-year
At a time Wichita leaders promote forward momentum in the Wichita economy, year-over-year employment has fallen.
-
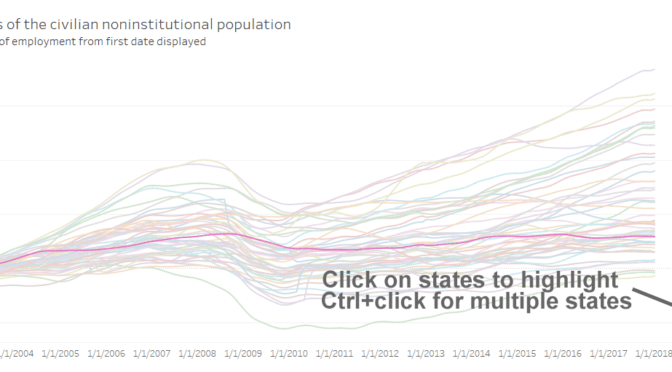
Employment in the states
An interactive visualization of the civilian labor force, employment, and unemployment, for each state.
-
Sedgwick County’s David Dennis on economic development
Following the Wichita Mayor, the Chair of the Sedgwick County Commission speaks on economic development.
-

From Pachyderm: Can Wichita Elect a Governor?
From the Wichita Pachyderm Club: Dr. Russell Arben Fox, who is Professor of Political Science at Friends University. His topic was “Can Wichita Elect a Governor? Musings on the Kansas Political Landscape.”
-
Mayor Longwell’s pep talk
A column written by Wichita Mayor Jeff Longwell ignores the reality of Wichita’s economy.
-

Kansas government data may not be available
There is a movement to increase the transparency of government in Kansas, but there’s much to be done, starting with attitudes.
-

Property under attack in Kansas
Local governments in Kansas are again seeking expanded power to seize property.
-

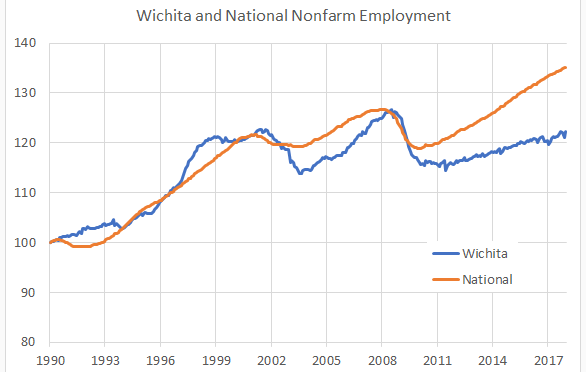
Growing the Wichita economy
Wichita leaders are proud of our region’s economic growth. Here are the numbers.
-

WichitaLiberty.TV: What Was Really the Matter with the Kansas Tax Plan
Dave Trabert of Kansas Policy Institute joins Bob and Karl to discuss his new book What Was Really the Matter with the Kansas Tax Plan –- The Undoing of a Good Idea.
-

What Was Really the Matter with the Kansas Tax Plan
Tax relief opponents have repeatedly pointed to the 2012 Kansas tax plan as their primary example of why tax cuts do not work. But, other states like North Carolina, Indiana, and Tennessee contemporaneously, and successfully, cut taxes. What was different about the Kansas experience?
-
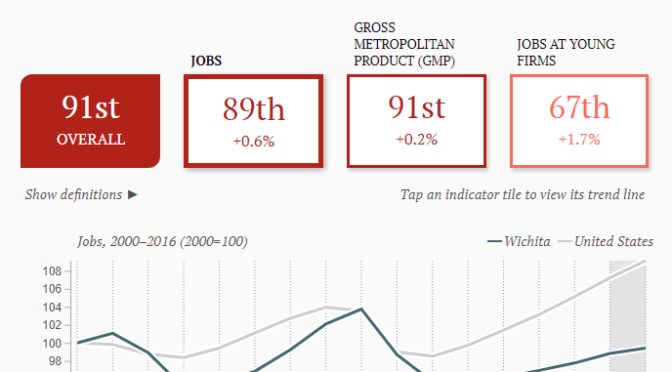
Metro Monitor evaluates the Wichita economy
Metro Monitor from Brookings Institution ranks metropolitan areas on economic performance. How does Wichita fare?
-

WichitaLiberty.TV: Kansas Gubernatorial Candidate Dr. Jim Barnett
Dr. Jim Barnett is a candidate for the Republican Party nomination for Kansas Governor. He joins Bob Weeks to make the case as to why he should be our next governor.