Tag: Featured
-
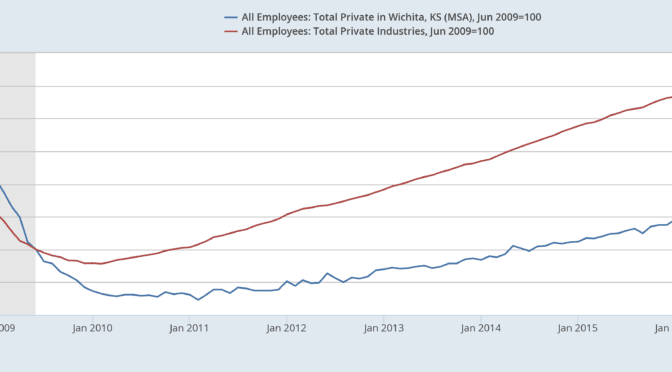
Wichita post-recession job growth
Wichita has recovered from recessions, but after the most recent, the city is falling further behind.
-
As Wichita considers new ventures, a look back at some data
The City of Wichita will soon be flooded with data regarding downtown convention and performing arts facilities. Past experience should warn us to be skeptical.
-

Medicaid expansion survey in Kansas
Should Kansans accept the results of a public opinion poll when little is known about it?
-

Breaking the statehouse budget deadlock
Kansas taxpayers need to have a say in the massive new spending schemes appearing at the statehouse, writes Karl Peterjohn.
-

Wichita about to commit to more spending. Bigly.
This week the Wichita City Council considers hiring a consulting firm to develop plans for a new performing arts and convention center.
-

WichitaLiberty.TV Sedgwick County Commissioner Richard Ranzau
Sedgwick County Commissioner Richard Ranzau joins Bob Weeks and Karl Peterjohn to discuss current issues in Sedgwick County government.
-

On Wichita’s STAR bond promise, we’ve heard it before
Are the City of Wichita’s projections regarding subsidized development as an economic driver believable?
-
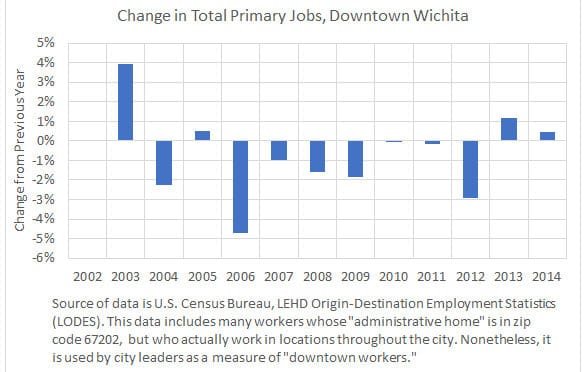
Growth in Downtown Wichita Jobs
Even if we accept the measure of jobs used by the City of Wichita, the trend is in the wrong direction. Citizens should ask for truth and accountability.
-

WichitaLiberty.TV: Kansas Policy Institute President Dave Trabert
Kansas Policy Institute Dave Trabert joins Bob Weeks and Karl Peterjohn to discuss the Kansas economy, budget, and schools.
-
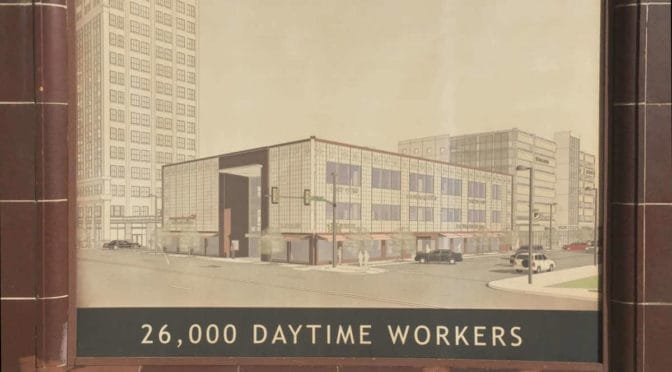
Downtown Wichita jobs, sort of
The claim of 26,000 workers in downtown Wichita is based on misuse of data so blatant it can be described only as malpractice.
-

Downtown Wichita’s Block One, a beneficiary of tax increment financing
Before forming new tax increment financing districts, Wichita taxpayers ought to ask for progress on current districts.
-

Shocking News about Kansas Education!
Listening too often to Topeka politicians and administrators can leave a normal person feeling rather jaded, even used. Or maybe it’s the reporting, sometimes I just don’t know, writes Paul Waggoner.