Tag: Featured
-

No one is stealing* from KPERS
No one is stealing from KPERS, the Kansas Public Employees Retirement System. But there are related problems.
-

Won’t anyone develop in downtown Wichita without incentives?
Action the Wichita City Council will consider next week makes one wonder: If downtown Wichita is so great, why does the city have to give away so much?
-

Year in Review: 2016
Here are highlights from Voice for Liberty for 2016. Was it a good year for the principles of individual liberty, limited government, economic freedom, and free markets in Wichita and Kansas?
-

In Wichita, we’ll not know how this tax money is spent
Despite claims to the contrary, the attitude of the City of Wichita towards citizens’ right to know is poor, and its attitude will likely be reaffirmed this week.
-

In Wichita, converting a hotel into street repairs
In Wichita, it turns out we have to sell a hotel in order to fix our streets.
-
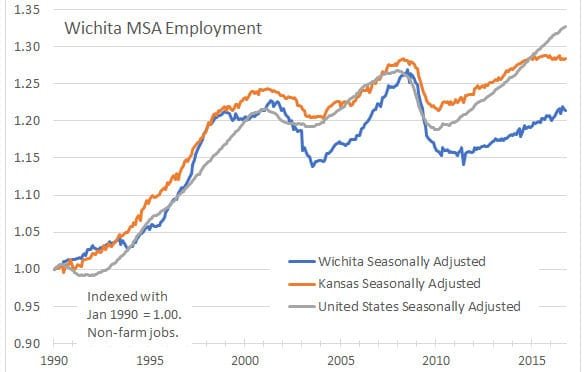
The Wichita economy, according to Milken Institute
The performance of the Wichita-area economy, compared to other large cities, is on a downward trend.
-

Kansas school employees by type
An interactive visualization of trends in Kansas school employment.
-

The plan to raise your taxes that can’t be found
A coalition of Kansas advocacy groups wants to raise your taxes, but the plan is difficult to find.
-

Economic development incentives at the margin
The evaluation of economic development incentives in Wichita and Kansas requires thinking at the margin, not the entirety.
-

Wichita to grant property and sales tax relief
Several large employers in Wichita ask to avoid paying millions in taxes, which increases the cost of government for everyone else, including young companies struggling to break through.
-

Gary Sherrer and Kansas Policy Institute
A former Kansas government official criticizes Kansas Policy Institute.
-
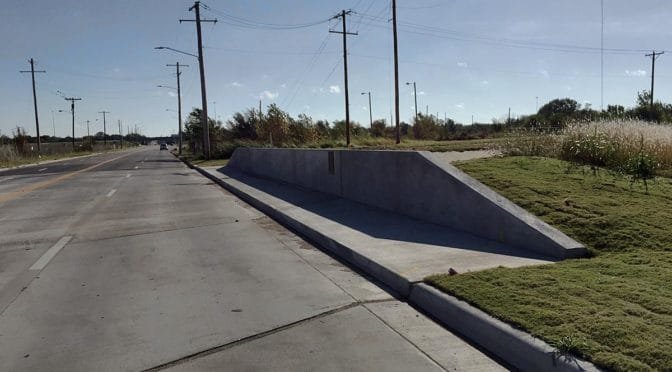
Wichita bridges, well memorialized
Drivers — like me — on East Twenty-First Street in Wichita are happy that the work on a small bridge is complete, but may not be pleased with one aspect of the project.