Tag: Featured
-

Wichita Eagle, where are you?
The Wichita Eagle avoids reporting and editorializing on an issue that is saving Wichita over one hundred million dollars. We wonder why.
-

In Wichita, the phased approach to water supply can save a bundle
In 2014 the City of Wichita recommended voters spend $250 million on a new water supply. But since voters rejected the tax to support that spending, the cost of providing adequate water has dropped, and dropped a lot.
-

Sales tax revenue and the Kansas highway fund
The effect of a proposed bill to end transfer of Kansas sales tax revenue to the highway fund is distorted by promoters of taxation and spending.
-

Kansas and Colorado, compared
News that a Wichita-based company is moving to Colorado sparked a round of Kansas-bashing, most not based on facts.
-

At Pachyderm: Police Chief Gordon Ramsay
The Wichita Pachyderm Club featured Wichita Police Chief Gordon Ramsay speaking on the topic “There’s a New Chef in Town.”
-

Math quiz on Kansas spending
The average Kansan is misinformed regarding Kansas school spending, and Kansas news media are to blame, writes Paul Waggoner of Hutchinson
-
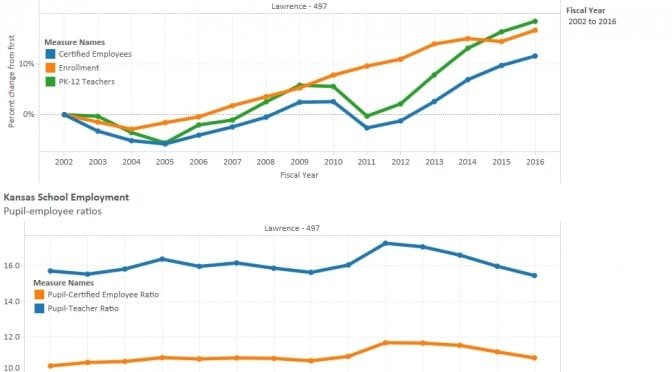
Lawrence school funding and employment
A Kansas school board president complains about funding, but the district has been able to grow employment faster than enrollment.
-

Wichita TIF district disbands; taxpayers on the hook
A real estate development in College Hill was not successful. What does this mean for city taxpayers?
-

Kansas Supreme Court judicial selection
Kansas progressives and Democrats oppose a judicial selection system that is used by U.S. Presidents, both Democrats and Republicans.
-

Power of Kansas cities to take property may be expanded
A bill working its way through the Kansas Legislature will give cities additional means to seize property.
-

In Kansas, doctors may “learn” just by doing their jobs
A proposed bill in Kansas should make us question the rationale of continuing medical education requirements for physicians.
-

Kansas teachers union opposes bill that empowers teachers
Kansas National Education Association, the state’s teachers union, opposes a bill that empowers teachers.