Tag: Featured
-

For Sedgwick County Zoo, a moratorium on its commitment
As the Sedgwick County Zoo and its supporters criticize commissioners for failing to honor commitments, the Zoo is enjoying a deferral of loan payments and a break from accumulating interest charges.
-

Sedgwick County budget outlook
The Sedgwick County recommended budget for 2016 reduces projected deficits.
-

‘Roast of Trump’ best left unserved
A celebrity roast of Donald Trump provides insight into the honoree’s character.
-
Wichita Eagle editorial board on county budget
When someone invokes “ideology” in their criticism of you, you know that they’ve either run short of actual arguments based on fact, or they don’t know what ideological means.
-
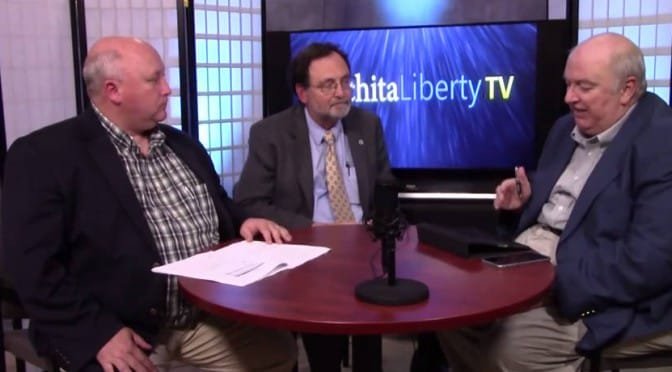
WichitaLiberty.TV: Sedgwick County Commissioners Karl Peterjohn and Richard Ranzau
WichitaLiberty.TV: Sedgwick County Commissioners Karl Peterjohn and Richard Ranzau
-

Government creates obstacles to progress
“Overcoming obstacles can be a difficult challenge even on a level playing field. We need to change the rigged system that favors the politically connected over the hardworking, honest citizen,” writes Charles Koch in a recent edition of Perspectives.
-
Friedman: Laws that do harm
As we approach another birthday of Milton Friedman, here’s his column from Newsweek in 1982 that explains that despite good intentions, the result of government intervention often harms those it is intended to help.
-
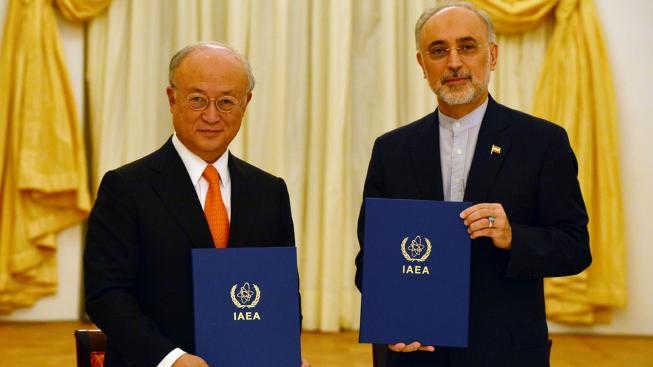
Pompeo: Disclose complete Iran nuclear deal
U.S. Representative Mike Pompeo and Arkansas Senator Tom Cotton urge disclosure of agreements between IAEA that are relevant to the Iran nuclear deal.
-

Westar: First, control blatant waste
As our electric utility asks for a rate increase, let’s first ask that it stop blatant waste.
-

Friedman: The fallacy of the welfare state
A simple classification of government spending shows why the process leads to undesirable results, explain Milton and Rose Friedman.
-

Wichita airport spends $180K on ads
The Wichita airport spends to produce and broadcast a television advertisement, and taxpayers didn’t have to pay. Sort of.
-

Wichita schools could increase engagement at no cost
The Wichita public school district could boost its engagement with citizens with a simple step that would add no cost.