Tag: Featured
-

Tax rates and taxes paid
Those who call for a return to 90 percent tax rates should be aware that few people actually paid tax at those rates.
-

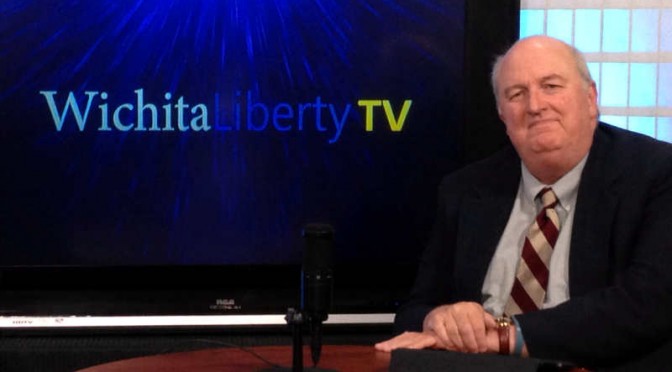
WichitaLiberty.TV: Radio show host Joseph Ashby
Radio talk show host Joseph Ashby joins host Bob Weeks to discuss his interview with Kansas Governor Sam Brownback, the end of the legislative session, and Republican presidential candidates.
-
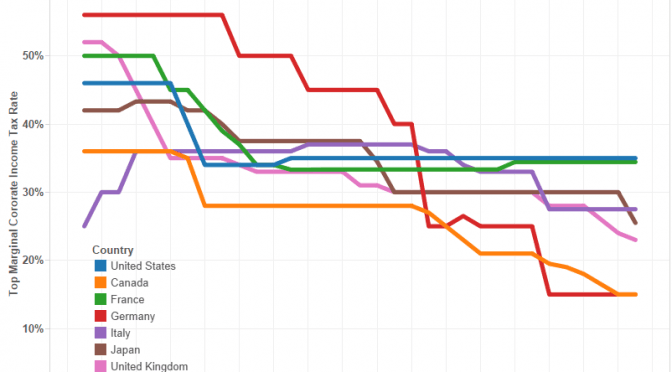
Corporate income tax rates in U.S. and other countries
Over the past two decades most large industrial countries have reduced their corporate income tax rates. Two countries, however, stand out from this trend: France and The United States.
-

With tax exemptions, what message does Wichita send to existing landlords?
As the City of Wichita prepares to grant special tax status to another new industrial building, existing landlords must be wondering why they struggle to stay in business when city hall sets up subsidized competitors with new buildings and a large cost advantage.
-

Wichita water statistics update
Updated statistics show that the Wichita ASR water project has not been producing water at the projected rate, even after projections were halved.
-
Wichita has cut waste, officials say
Wichita city officials say they have worked hard to eliminate waste. Well, except for this.
-

Taxation in the states
Examining tax collections by the states shows that Kansas collects more tax than many of our neighbors, and should put to rest some common myths.
-

Examining Kansas City school district claims
A critical look at the statements coming from one of the largest school districts in Kansas leads to wonder if the Kansas City school superintendent is uninformed, misinformed, or simply lying.
-

Jay Price on Generations: Shifting Thought Over the Decades
You’ve heard about the Silent Generation, Baby Boomers, Generation X, and others. Here, Professor Jay Price defines these terms and tells us about the characteristics of each generation
-
WichitaLiberty.TV: Arts funding, property taxes, uninformed officials, tax increment financing, and social security
Is Wichita risking a Soviet-style future? A look at Wichita property taxes, uninformed and misinformed elected officials, tax increment financing, and social security.
-
Spending in the states, a visualization
An interactive visualization of state spending per person.
-

In Wichita, campaigning for a tax, then asking for exemption from paying
Having contributed $5,000 to persuade Wichita voters to raise the sales tax, a company now seeks exemption from paying any sales tax.