Tag: Greater Wichita Partnership
-

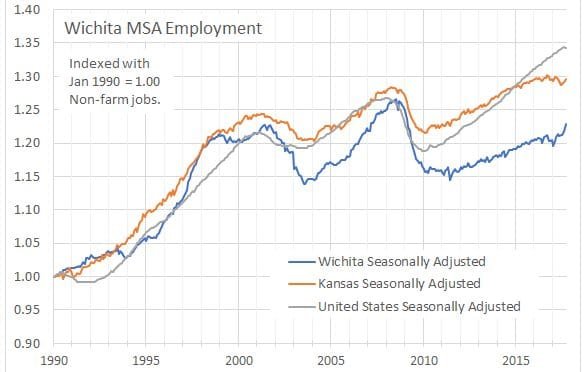
Wichita employment down, year-over-year
At a time Wichita leaders promote forward momentum in the Wichita economy, year-over-year employment has fallen.
-
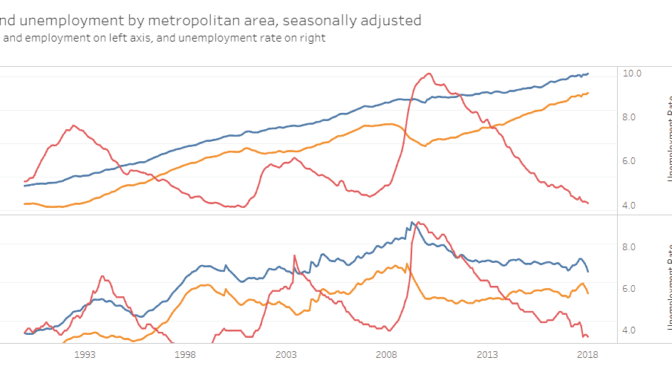
Employment in metropolitan areas
An interactive visualization of labor force, employment, and unemployment rate for all metropolitan areas in the United States.
-

Wichita employment down, year-over-year
At a time Wichita leaders promote forward momentum in the Wichita economy, year-over-year employment has fallen.
-
Mayor Longwell’s pep talk
A column written by Wichita Mayor Jeff Longwell ignores the reality of Wichita’s economy.
-
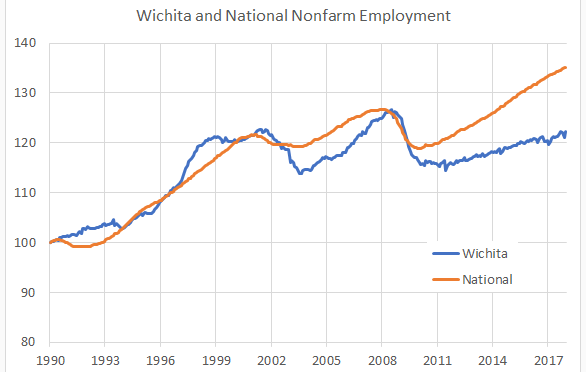
Growing the Wichita economy
Wichita leaders are proud of our region’s economic growth. Here are the numbers.
-
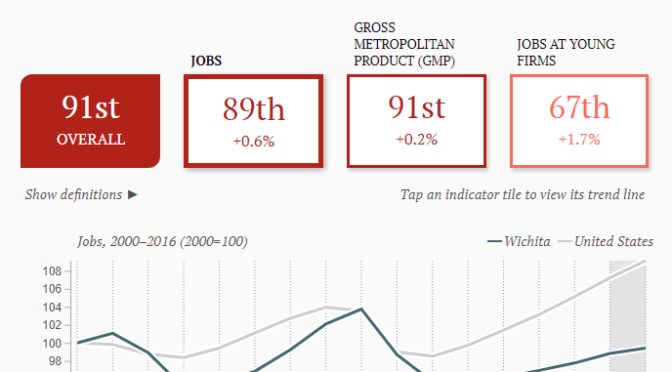
Metro Monitor evaluates the Wichita economy
Metro Monitor from Brookings Institution ranks metropolitan areas on economic performance. How does Wichita fare?
-

Greater Wichita Partnership asks for help
Wichita’s economic development agency asks for assistance in developing its focus and strategies.
-
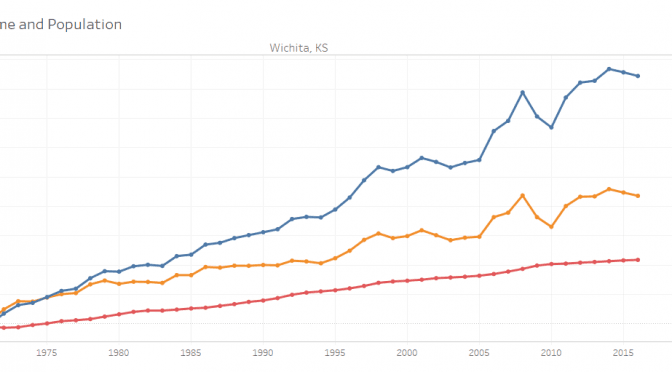
Wichita personal income up, a little
For 2016, personal income in Wichita rose, but is still below 2014 levels.
-
Wichita employment up
Employment in the Wichita metropolitan area is on an upward tick.