Tag: Greater Wichita Partnership
-
Wichita jobs and employment, September 2019
For the Wichita metropolitan area in September 2019, the labor force is up, the number of unemployed persons is down, the unemployment rate is down, and the number of people working is up when compared to the same month one year ago. Seasonal data shows small increases in labor force and jobs from August.
-
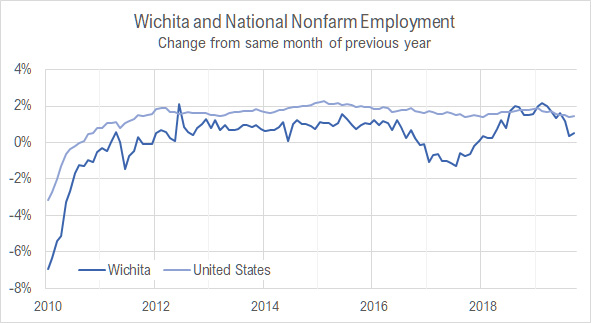
The cause of the low unemployment rate in Wichita
The unemployment rate for Wichita and the nation is nearly equal over the last eight years. Job growth for Wichita, however, has been much slower than the nation, and the labor force for Wichita is actually smaller than in January 2011. This is what has led to a low unemployment rate in Wichita: Slow job…
-
Wichita jobs and momentum
Given recent data and the CEDBR forecasts, Wichita’s momentum is a slowly growing economy, with the rate of growth declining.
-

Looking at jobs in Wichita
Examining job creation in Wichita as compared to the state and the nation.
-

Wichita jobs and employment, August 2019
For the Wichita metropolitan area in August 2019, the labor force is up, the number of unemployed persons is down, the unemployment rate is down, and the number of people working is up, all by small amounts, when compared to the same month one year ago. Seasonal data shows small increases in labor force and…
-

Metro Monitor for Wichita, 2019 edition
In a report looking at the economics of the 100 largest metropolitan areas, Wichita often ranks near the bottom.
-

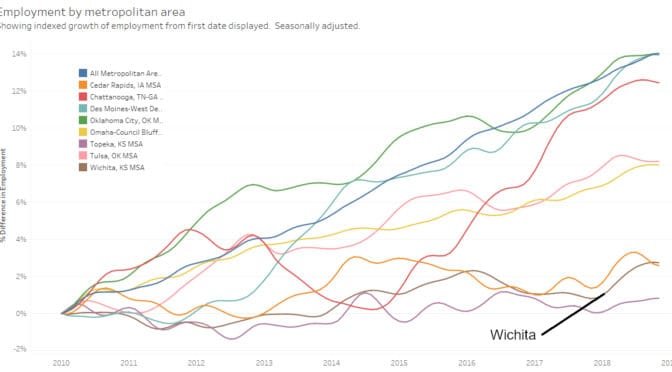
Wichita metro employment by industry
An interactive visualization of Wichita-area employment by industry.
-

Downtown Wichita jobs decline
Despite heavy promotion and investment in downtown Wichita, the number of jobs continues to decline.
-
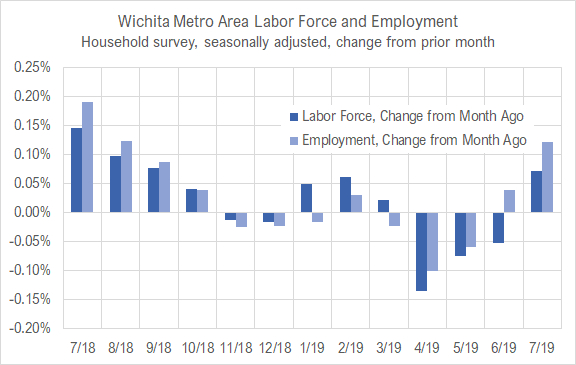
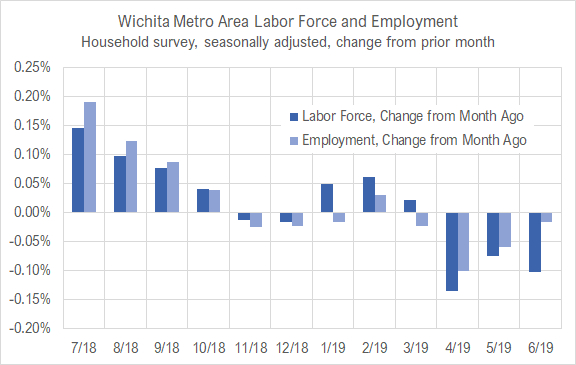
Wichita jobs and employment, July 2019
For the Wichita metropolitan area in July 2019, the labor force is up, the number of unemployed persons is down, the unemployment rate is down, and the number of people working is up when compared to the same month one year ago. Seasonal data shows small increases in labor force and jobs from June.
-
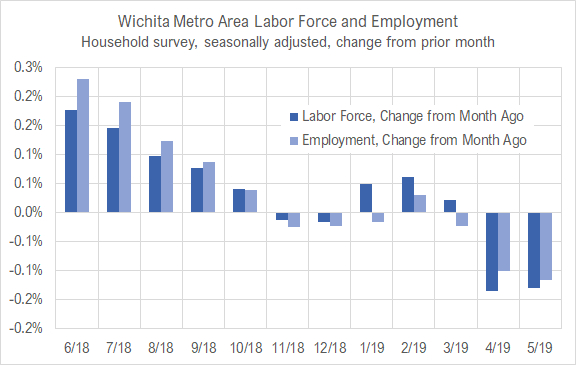
Wichita jobs and employment, June 2019
For the Wichita metropolitan area in May 2019, the labor force is up, the number of unemployed persons is up, the unemployment rate is unchanged, and the number of people working is up when compared to the same month one year ago. Seasonal data shows declines in labor force and jobs from April.
-
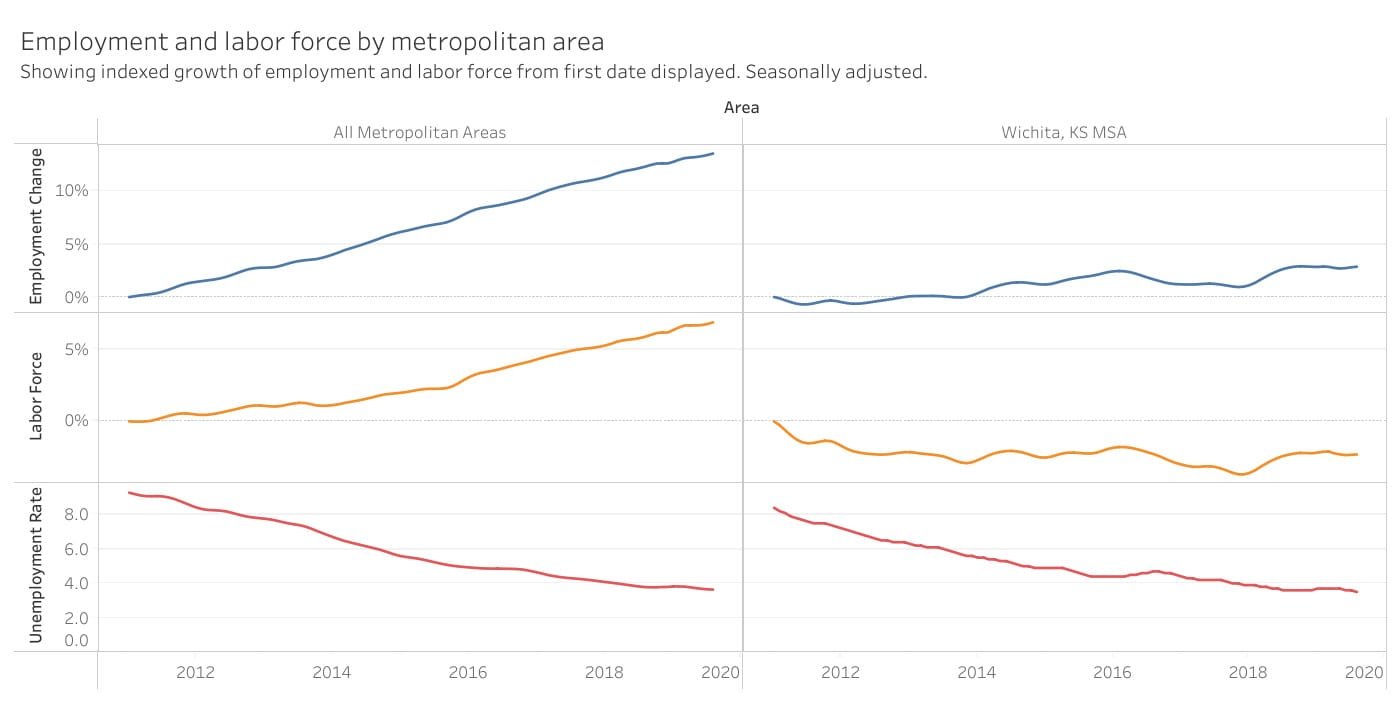
Metropolitan employment and labor force
A visualization of employment, labor force, and unemployment rate for metropolitan areas, now with data through May 2019.
-
Wichita jobs and employment, May 2019
For the Wichita metropolitan area in May 2019, the labor force is up, the number of unemployed persons is up, the unemployment rate is unchanged, and the number of people working is up when compared to the same month one year ago. Seasonal data shows declines in labor force and jobs from April.