Tag: Joseph R. Biden
-
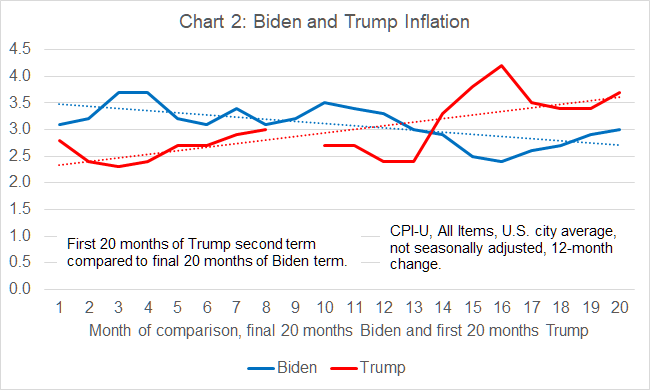
Biden vs. Trump Inflation: What the September 2026 CPI Data Really Shows
Two charts, one CPI data set: Biden’s final 20 months versus Trump’s first 20 months of his second term, lined up month by month, with a new September 2026 reading included.
-
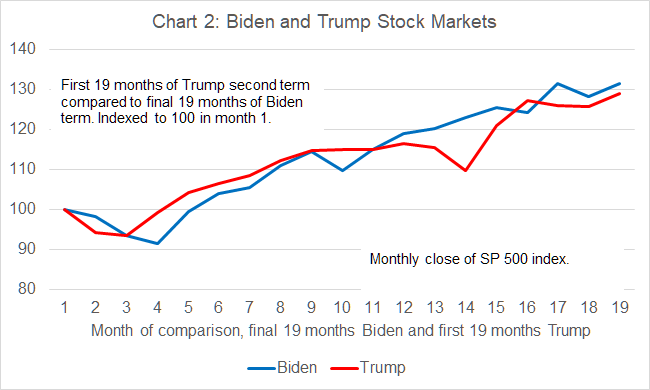
The Trump Stock Market
Two charts compare S&P 500 performance under Biden’s final 19 months and Trump’s first 19 months as president — raw values and indexed growth, explained.
-

Trump, Biden, Obama Votes
In this statement attributed to Donald J. Trump, he asserts that Joe Biden received 15 million more votes in 2020 than Barack Obama did in 2012 (81 million vs. 65.9 million). Trump further claims Biden “beat” Obama in every swing state among Black voters despite those voters supposedly “hating him,” concluding that the 2020 election…
-
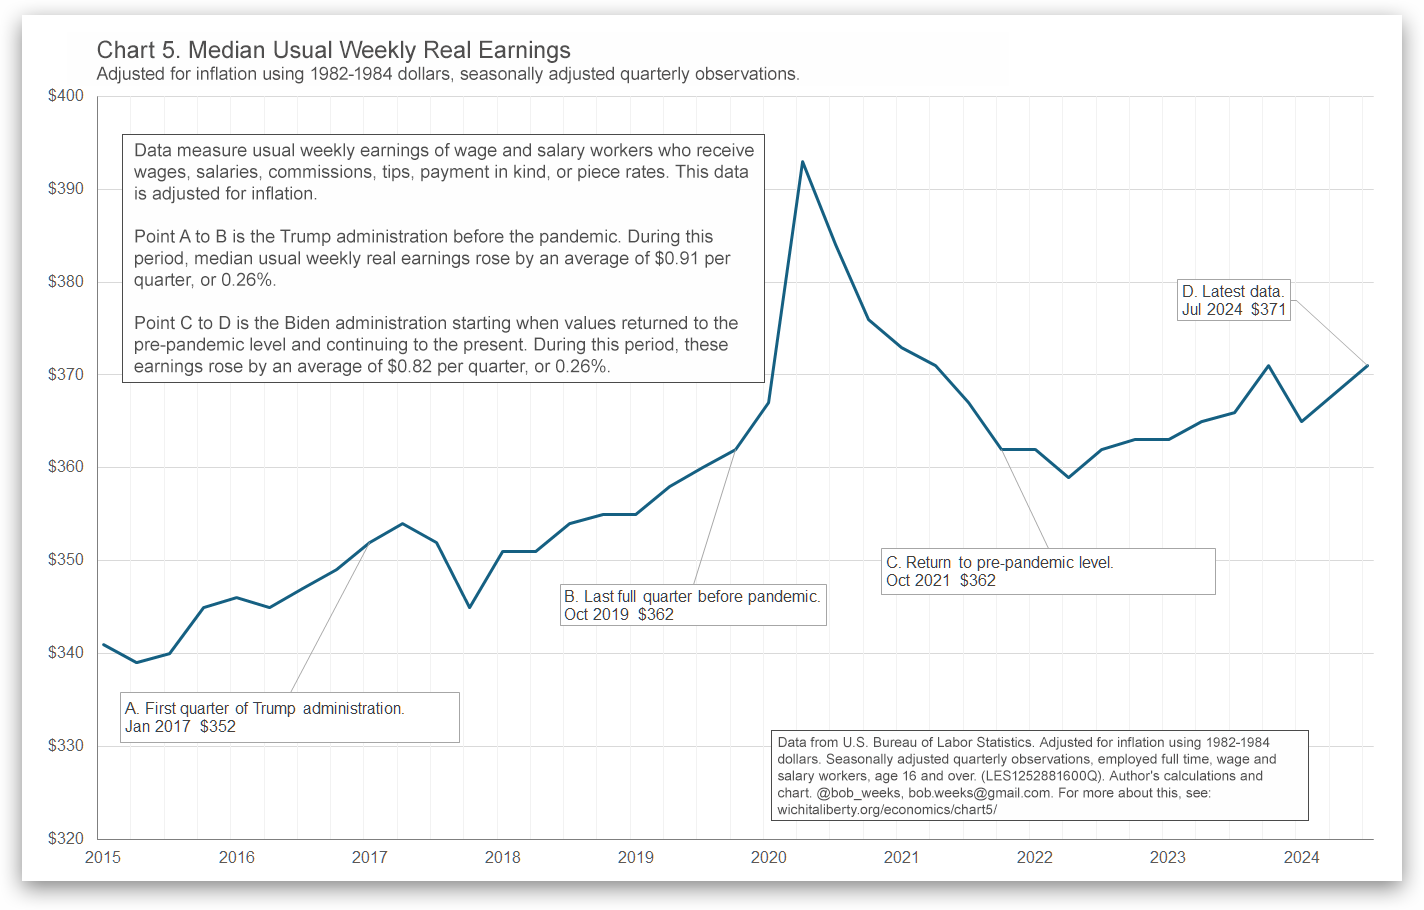
Median Usual Weekly Real Earnings, pre- and post-Covid
Comparing weekly earnings before and after the Covid pandemic, attempting to remove the effect of the pandemic.
-
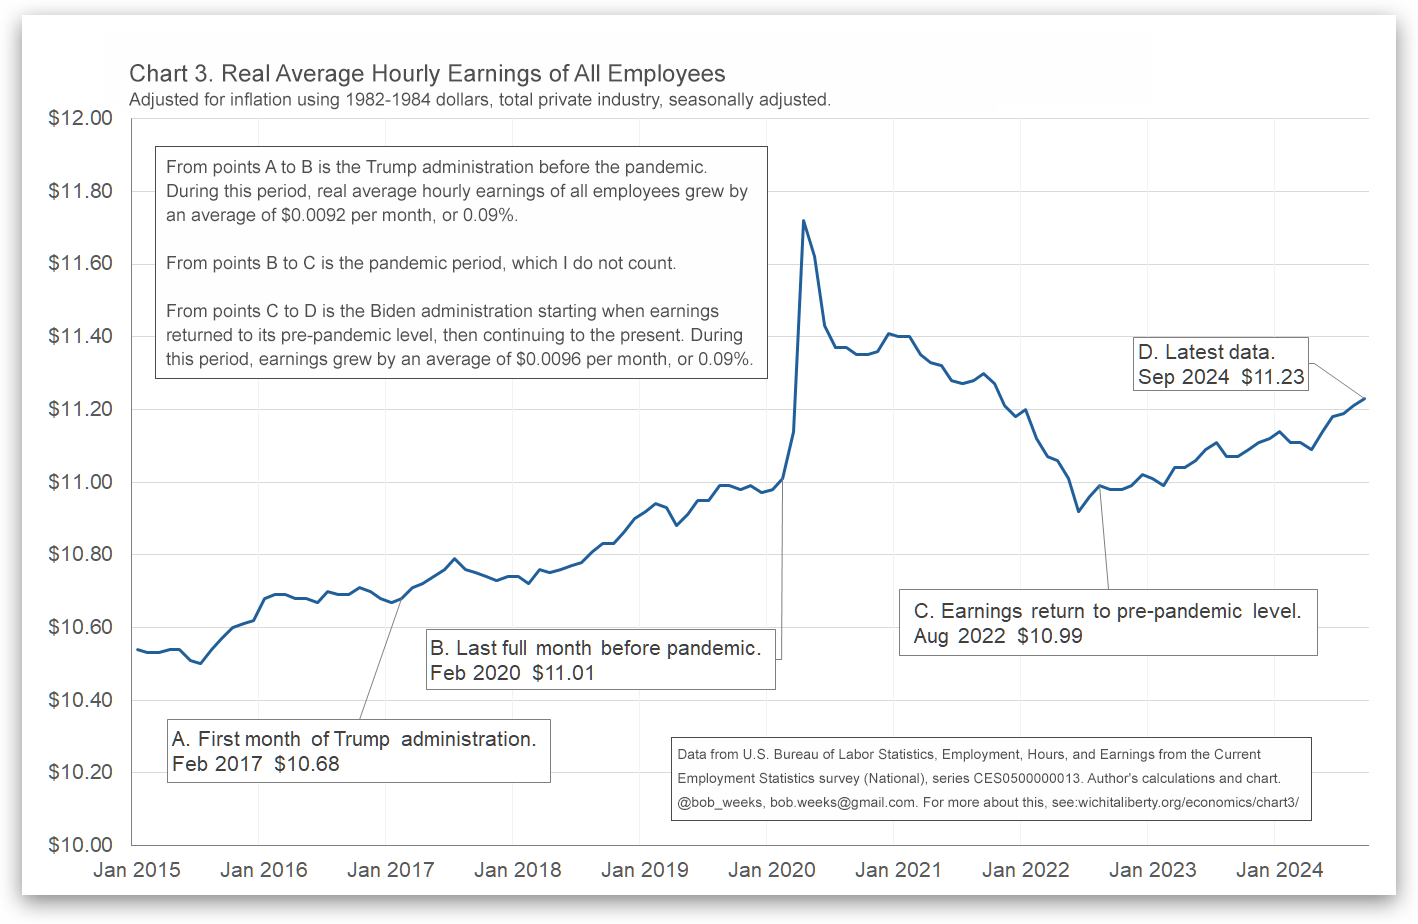
Hourly Earnings, pre- and post-Covid
Comparing hourly earnings before and after the Covid pandemic, attempting to remove the effect of the pandemic.
-
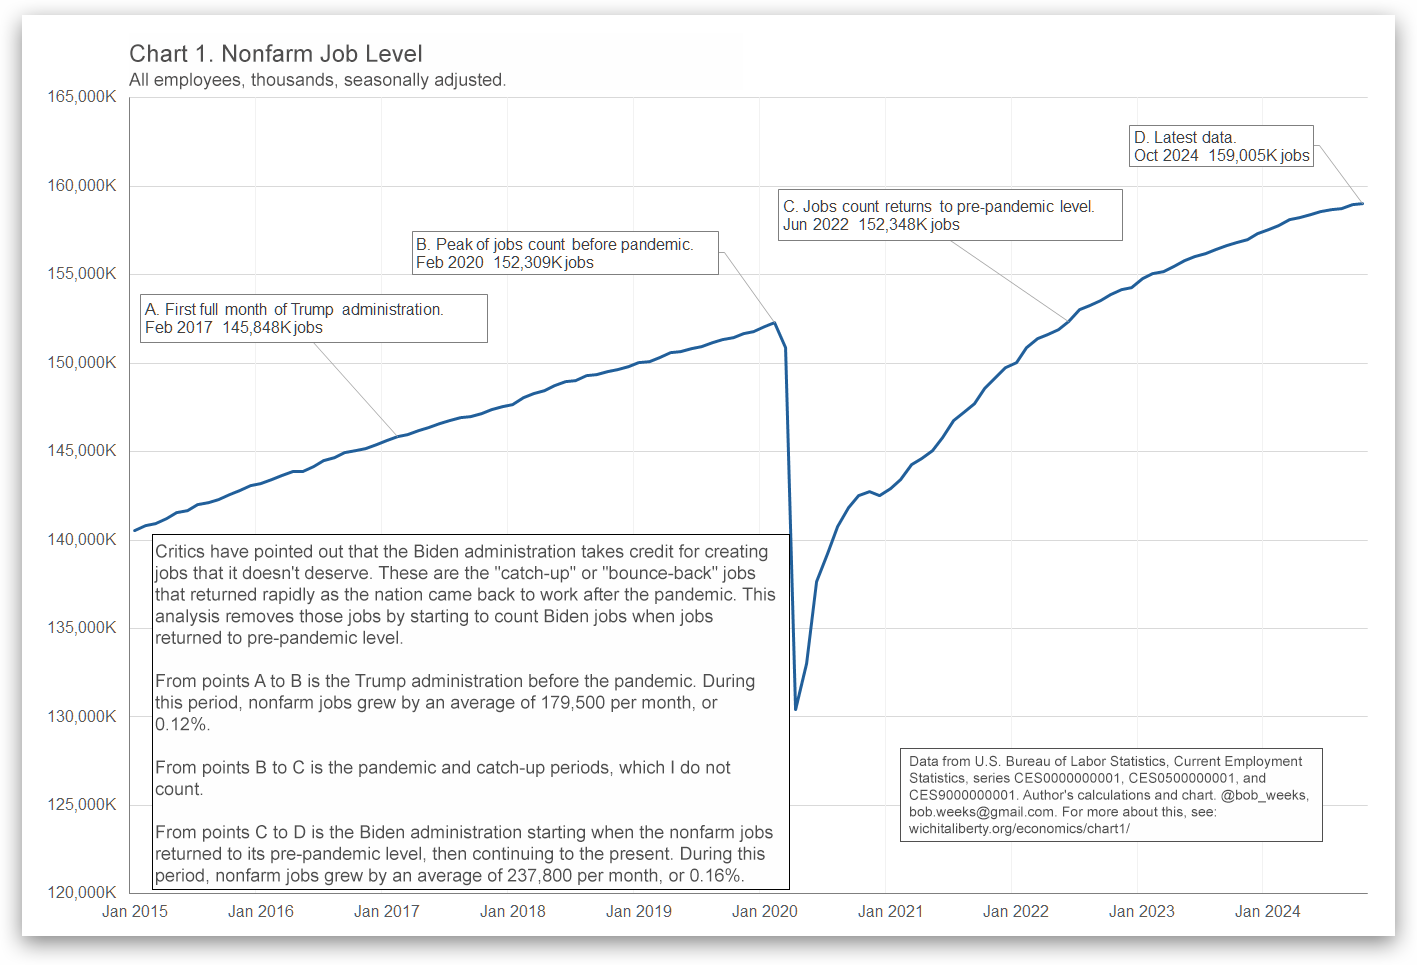
Employment, pre- and post-Covid
Comparing job growth before and after the Covid pandemic, attempting to remove the effect of the pandemic.
-
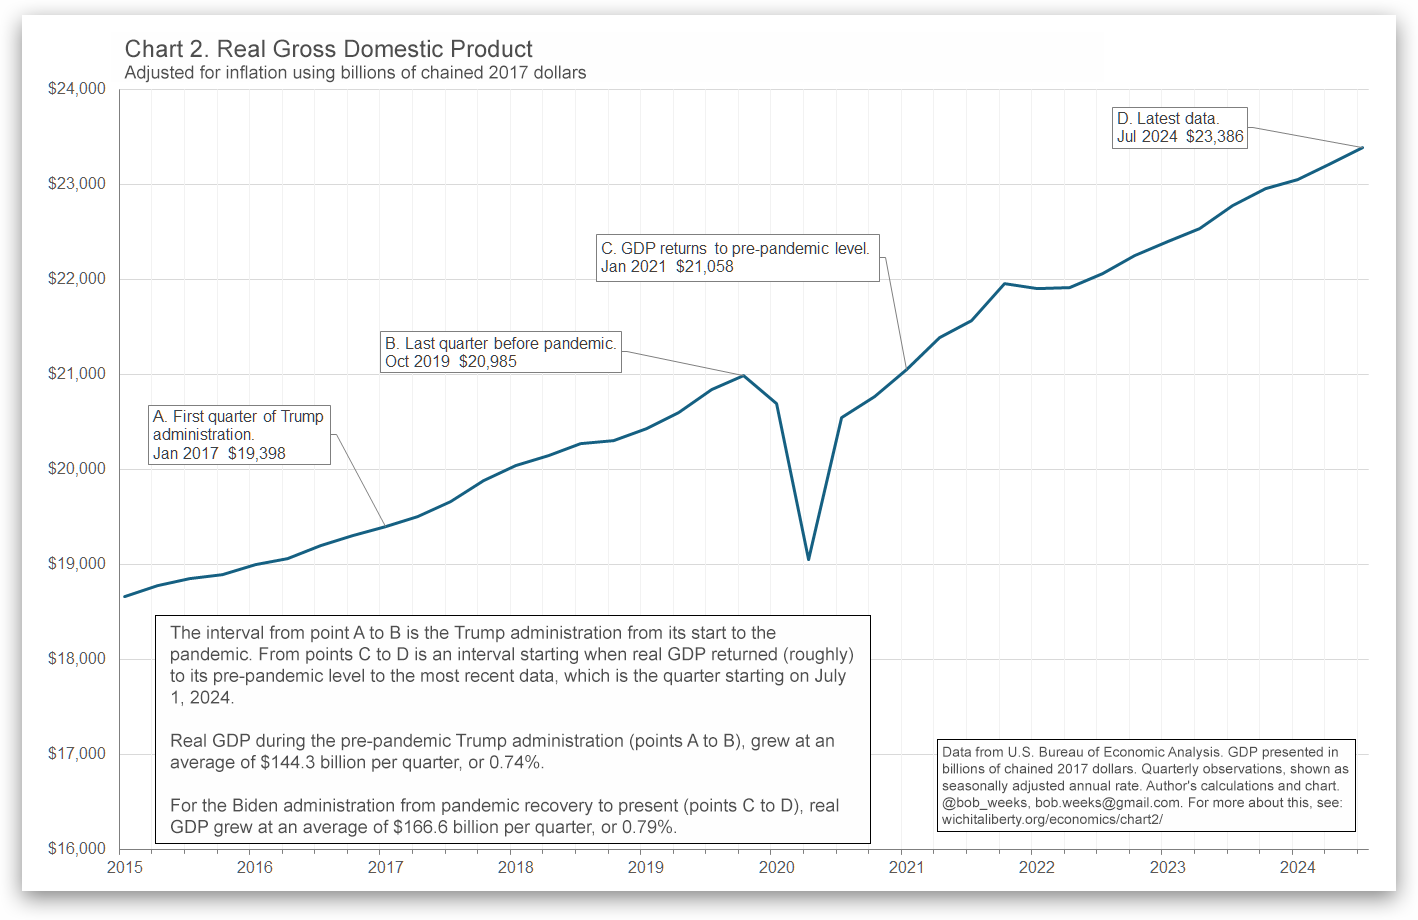
Gross Domestic Product, pre- and post-pandemic
Recent economic performance as measured by Gross Domestic Product, before and after the pandemic.
-
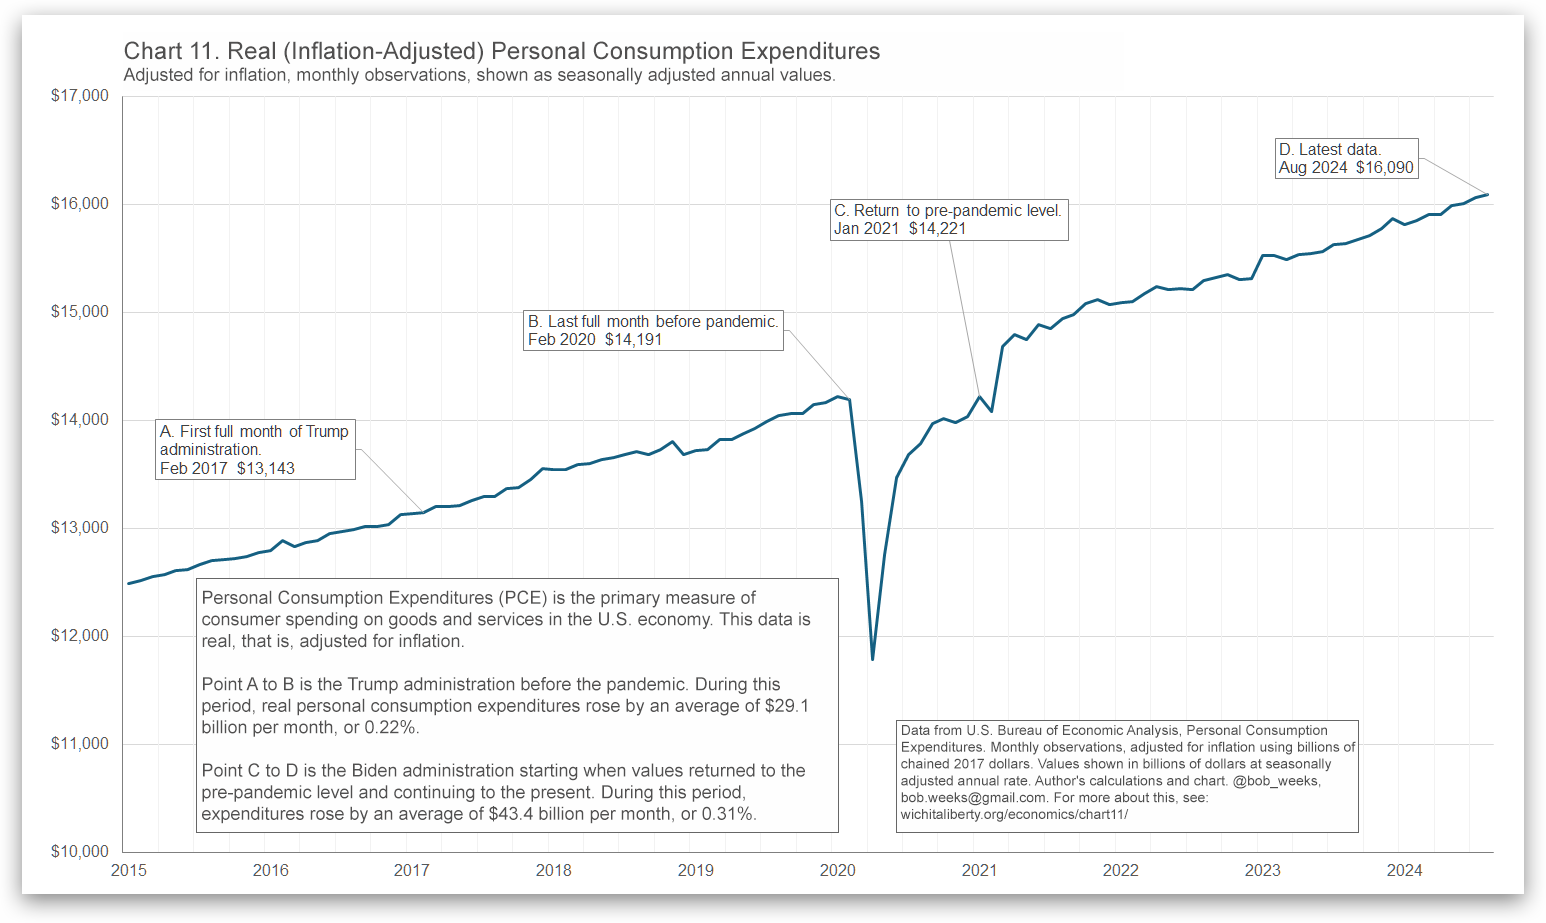
Personal Consumption Expenditures, pre- and post-Covid
Comparing real, inflation-adjusted personal consumption expenditures before and after the Covid pandemic, attempting to remove the effect of the pandemic.
-

Real Disposable Personal Income, pre- and post-Covid
Comparing real disposable personal income before and after the Covid pandemic, attempting to remove the effect of the pandemic.
-

Real (Inflation-Adjusted) Personal Income Excluding Transfers, Pre- and post-Covid
Comparing real (inflation-adjusted) personal income excluding current transfer receipts before and after the Covid pandemic, attempting to remove the effect of the pandemic.
-

Real Private Nonresidential Fixed Investment
Comparing business investment before and after the pandemic.
-

Employment, pre- and post-Covid
Comparing job growth before and after the Covid pandemic, attempting to remove the effect of the pandemic.