Tag: Kansas legislature
-

Kansas school spending, through 2018
Charts of Kansas school spending presented in different forms.
-

From Pachyderm: Economic development incentives
A look at some of the large economic development programs in Wichita and Kansas.
-
From Pachyderm: Kansas House candidates
From the Wichita Pachyderm Club: Republican Party Kansas House of Representatives candidates.
-

Kansas agriculture and the economy
What is the importance of agriculture to the Kansas economy?
-
From Pachyderm: Kansas House of Representatives Candidates
From the Wichita Pachyderm Club: Kansas House of Representatives Candidates. These are Republican candidates appearing on the November 6, 2018 general election ballot.
-
WichitaLiberty.TV: Primary election results, part two
In this episode of WichitaLiberty.TV: Hosts Karl Peterjohn and Bob Weeks continue reporting on some of the results of the August 7, 2018 primary election in Kansas.
-
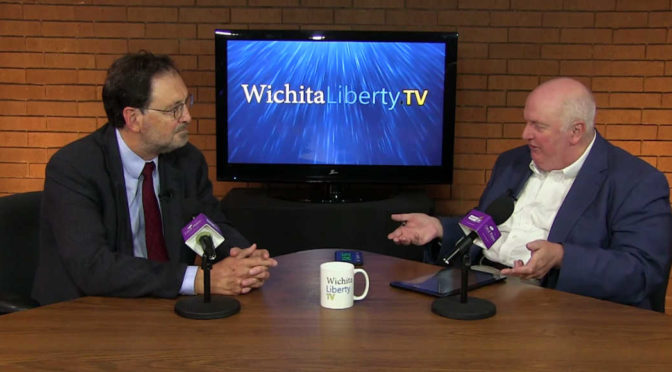
WichitaLiberty.TV: Primary election results
In this episode of WichitaLiberty.TV: Hosts Karl Peterjohn and Bob Weeks report on some of the results of the August 7, 2018 primary election in Kansas.
-
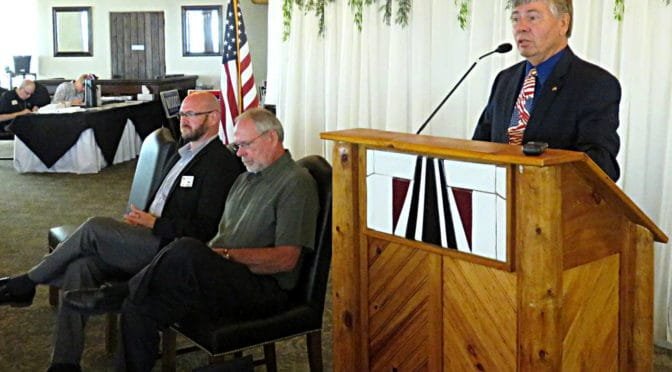
From Pachyderm: Candidates for Kansas House of Representatives
From the Wichita Pachyderm Club: Candidates for Kansas House of Representatives districts 74, 75, and 80. This was recorded on August 3, 2018.
-

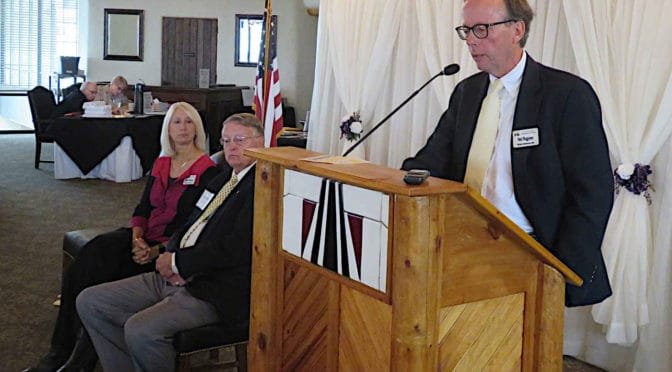
Kansas candidate briefings
Recently Kansas Policy Institute, along with Americans for Prosperity and Kansas Chamber of Commerce, held a series of briefings for candidates for the Kansas Legislature.
-
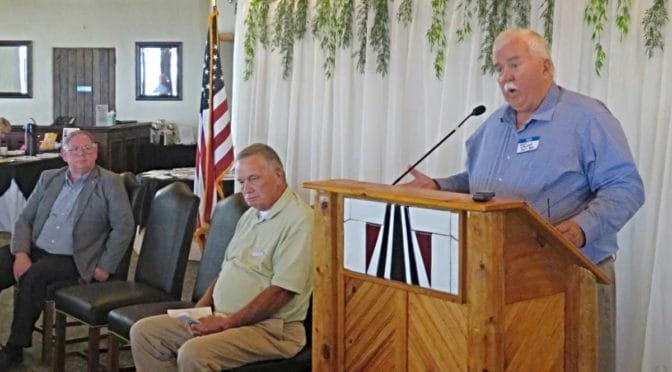
From Pachyderm: Kansas House of Representatives Candidates
From the Wichita Pachyderm Club: Kansas House of Representatives Candidates for districts 97 and 100. This was recorded June 29, 2018.
-
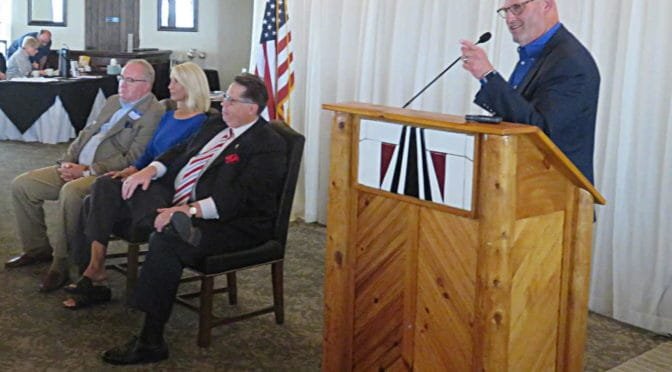
From Pachyderm: Kansas House of Representatives Candidates
From the Wichita Pachyderm Club: Kansas House of Representatives Candidates for districts 87 and 93. This was recorded June 22, 2018.
-
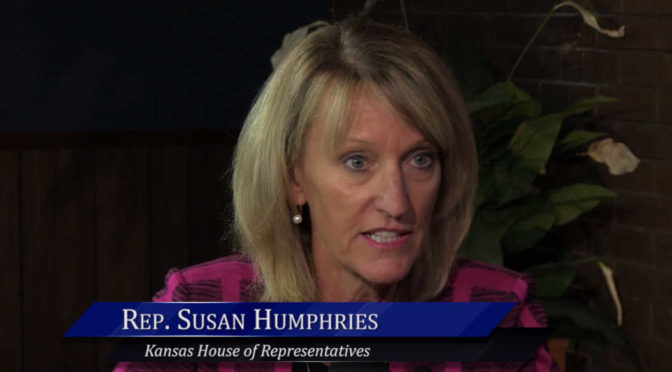
WichitaLiberty.TV: Kansas Representative Susan Humphries
Kansas Representative Susan Humphries, a Republican who represents district 99 (east Wichita and Andover), gives an update on Kansas legislative affairs.