Tag: Kansas legislature
-
WichitaLiberty.TV: James Franko of Kansas Policy Institute
James Franko of Kansas Policy Institute joins Bob Weeks and Karl Peterjohn to discuss education in Kansas and the state budget.
-

For some, the Kansas tax increase wasn’t big enough
Some Kansas Senators were refreshingly honest about a recent tax bill: They’re coming back for more.
-

Vote-switching in the Kansas House of Representatives
A look at voting behavior in the Kansas House of Representatives regarding an important tax bill.
-
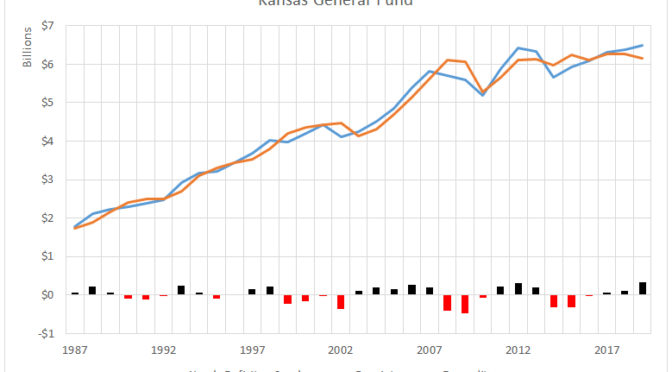
Kansas general fund
Data and charts regarding the Kansas general fund.
-

Kansas teachers union versus students
There’s no surprise that a labor union would support its members over all other considerations, even Kansas schoolchildren.
-

WichitaLiberty.TV: Immunizations, spending and taxing in Kansas, and getting data from Wichita
In this episode of WichitaLiberty.TV: Should Sedgwick County be in competition with the private sector? What are attitudes towards taxation and spending in Kansas? Finally, what is it like to request data from the City of Wichita? Episode 138, broadcast February 12, 2017.
-
Expanding Medicaid in Kansas
Expanding Medicaid in Kansas would be costly, undoubtedly more costly than estimated, has an uncertain future, and doesn’t provide very good results for those it covers.
-

Kansans say no to more taxes
A statewide poll finds little support for raising taxes as a way to balance the Kansas budget.
-

Public education factbook for 2017
The fifth edition of data on public schools in Kansas is available.
-

WichitaLiberty.TV: Blight, guns, testimony, and KPERS
Co-host Karl Peterjohn joins Bob Weeks to discuss the fight on blight and property rights, guns on campus, availability of testimony in the Kansas Legislature, and KPERS, our state’s retirement system.
-

Analysis of proposed tax changes in Kansas
Proposed changes in the Kansas motor fuel tax and sales tax on groceries affects households in different ways.
-

Availability of testimony in the Kansas Legislature
It is easy to provide Kansans with written testimony from the Kansas Legislature. At least I think so.