Tag: Kansas State Department of Education
-

Year in Review: 2014
Here is a sampling of stories from Voice for Liberty in 2014.
-

Kansans still uninformed on school spending
As in the past, a survey finds Kansans are uninformed or misinformed on the level of school spending, and also on the direction of its change.
-

Kansas school teacher cuts, student ratios
What has been the trend in Kansas school employment and pupil-teacher ratio?
-

In Kansas, school employment rises again
For the fourth consecutive year, the number of teachers in Kansas public schools has risen faster than enrollment, leading to declining pupil-teacher ratios.
-
Kansas school spending visualization updated
There’s new data available from Kansas State Department of Education on school spending. I’ve gathered the data, adjusted it for the consumer price index, and now present it in this interactive visualization. Click here to open the visualization in a new window.
-
Kansas school spending updated for 2014
Updated figures for Kansas school spending are now available from the Kansas State Department of Education.
-
Kansas school fund balances
Kansas school fund balances declined this year, but fund balances are still large.
-
Kansas schools shortchanged
Kansas schools could receive $21 million annually in federal funds if the state had adequate information systems in place.
-

Kansas school claims, numbers don’t match
Kansas school spending advocates make claims of exploding class sizes that aren’t reflected in enrollment and employment data
-

What is truth on education finance in Kansas?
One must wonder how much of Kansas’ and the nation’s student achievement woes are attributable to political self-interest and putting a higher priority on institutions than on the needs of individual students, writes Dave Trabert of Kansas Policy Institute.
-
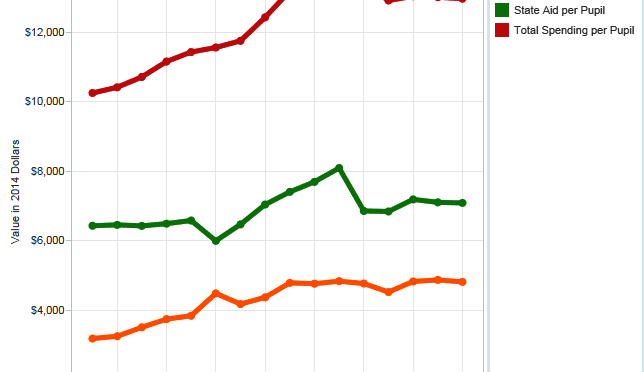
Kansas base state aid is only a part of spending
Using base state aid per pupil as the only measure of school funding leads to an incomplete understanding of school spending in Kansas.
-
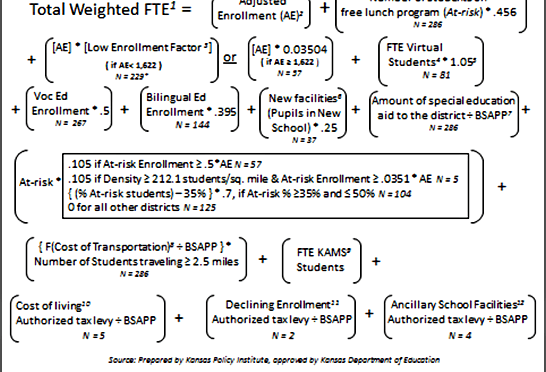
Kansas school finance formula explained
The updated version of the formula that will be used by the Kansas State Department of Education to determine student weighting in the coming school year is presented below.