For April 2022, Kansas tax revenue was 54.2 percent greater than April 2021, and collections through the first ten months of the fiscal year are 13.3 percent greater than the prior year. Individual income tax was over twice the amount of last April.
Tax reports from the State of Kansas for April 2022 show tax revenues rising from the previous month and greater than the same month the prior year.
When reporting on Kansas tax collections, the comparison is usually to the estimated tax collections. Those estimates are revised based on economic conditions. To get a feel for the effects of the Kansas economy and state tax policy, we should compare to the same month the prior year. (The estimated revenue figures are still important because the state bases the budget on them. If the actual revenue is below the estimated revenue, there may not be enough income to pay expenses.)
For April 2022, individual income tax collections were $1,018.7 million, up by 109.1 percent from last April. Retail sales tax collections rose by 3.6 percent to $245.0 million from last April. Total tax collections were $1,514.9 million, up 54.2 percent from last April. Table 1 summarizes. (Click charts and tables for larger versions.)
For fiscal year 2022, which started on July 1, 2021, total tax collections are higher by 13.3 percent over the same period of the previous fiscal year. Table 2 shows these figures.
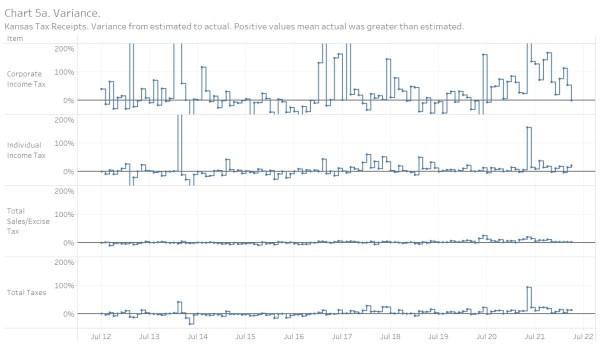
Kansas tax revenues continue to outperform estimates. When the line is above zero in nearby chart 5a, actual revenue was greater than the estimate, and the line is nearly always positive for the past five years or so. Estimates are essential because the legislature uses them to make spending decisions. Beyond that, the variance between actual revenue and the estimate doesn’t have much meaning. The governor uses a positive variance as a sign of economic success, but this is incorrect. It just as easily means the estimates are wrong, possibly for reasons other than the inherent difficulties of making estimates.
Over the past five or so years, revenues have exceeded estimates, sometimes by large margins. Chart 5b shows the cumulative variance for each fiscal year. The trend of positive variances starting with fiscal year 2018 is distinct. This chart does not show total collections and does not illustrate the health of the Kansas economy. It simply compares estimates to actuals.
I have updated my interactive visualization of Kansas tax revenue with this data. Click here to use it.
As of this writing, the governor has not issued a press release for this news. The report from Kansas Legislative Research Department is available on this page.


Leave a Reply