-

Newsletter for February 14, 2021
Read more: Newsletter for February 14, 2021Here is your fresh edition of the newsletter from Voice For Liberty. This edition is dated February 14, 2021.
-

Say no to special tax treatment, again
Read more: Say no to special tax treatment, againIn Kansas, a company seeks to avoid paying property taxes, again.
-
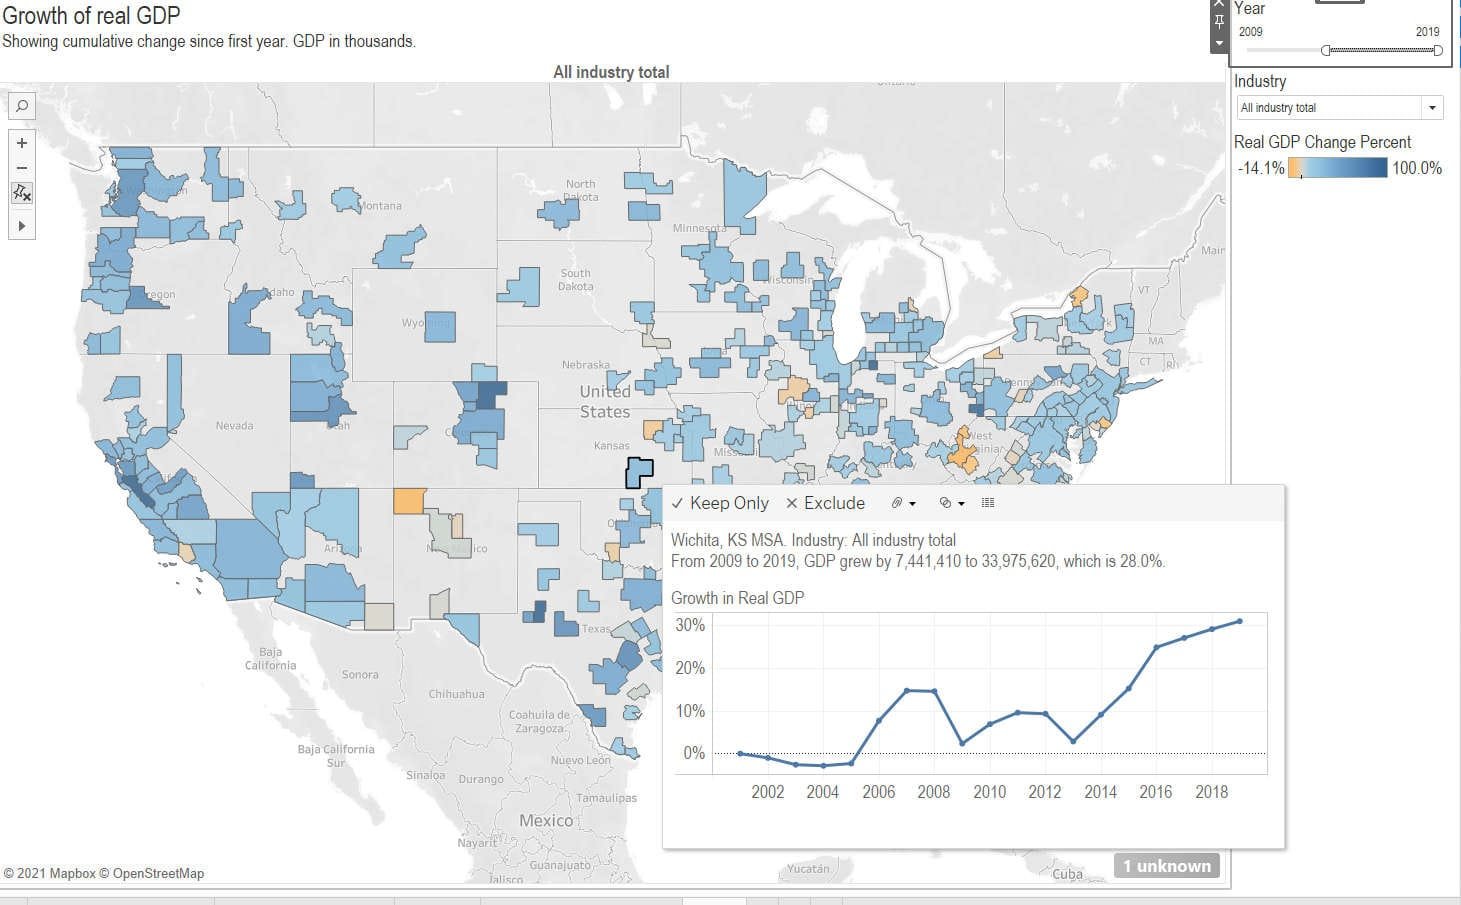
GDP by metropolitan area and component
Read more: GDP by metropolitan area and componentAn interactive visualization of gross domestic product by metropolitan area and industry.
-

Newsletter for February 7, 2021
Read more: Newsletter for February 7, 2021Here is your fresh edition of the newsletter from Voice For Liberty. This edition is dated February 7, 2021.
-
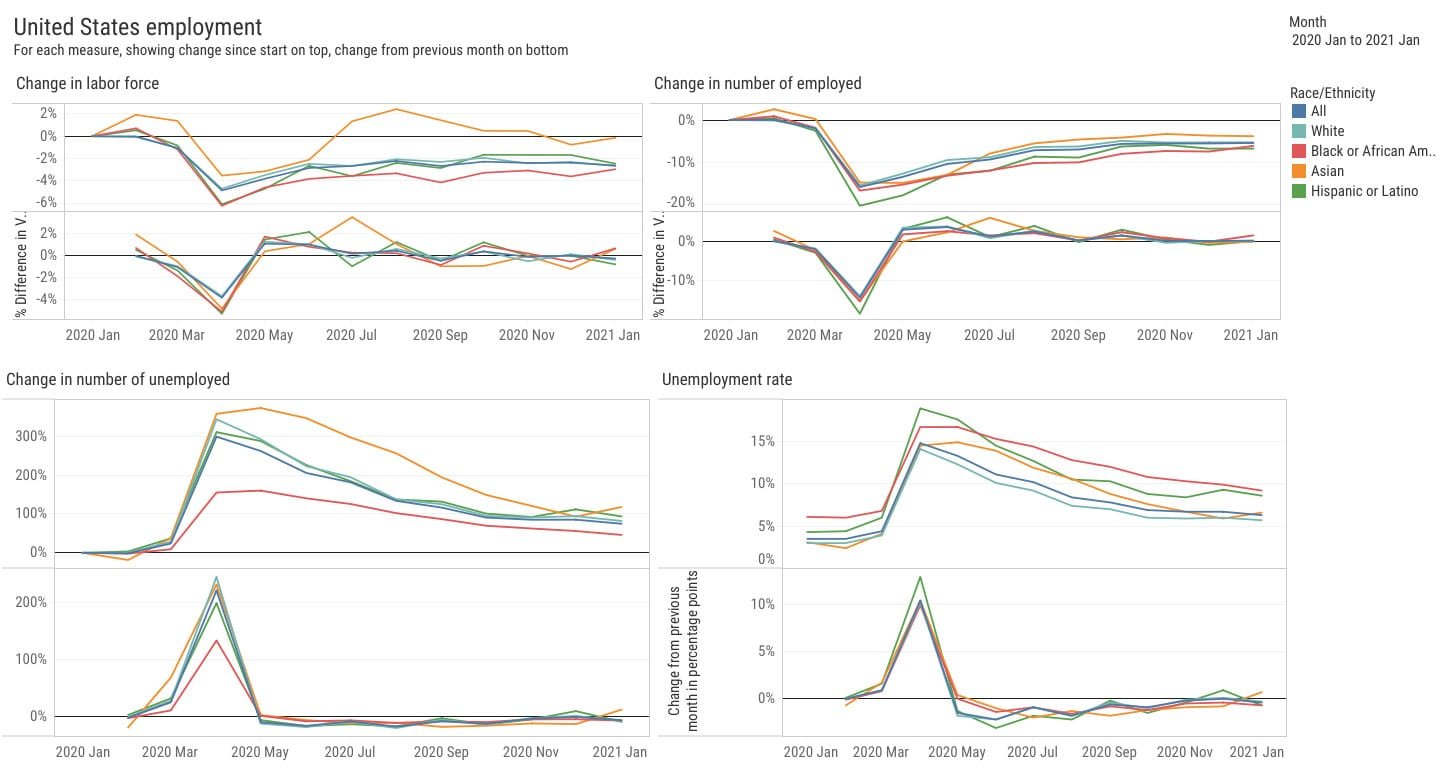
National employment, January 2021
Read more: National employment, January 2021The unemployment rate fell in January 2021, but job growth was weak, and the December value was revised.
-
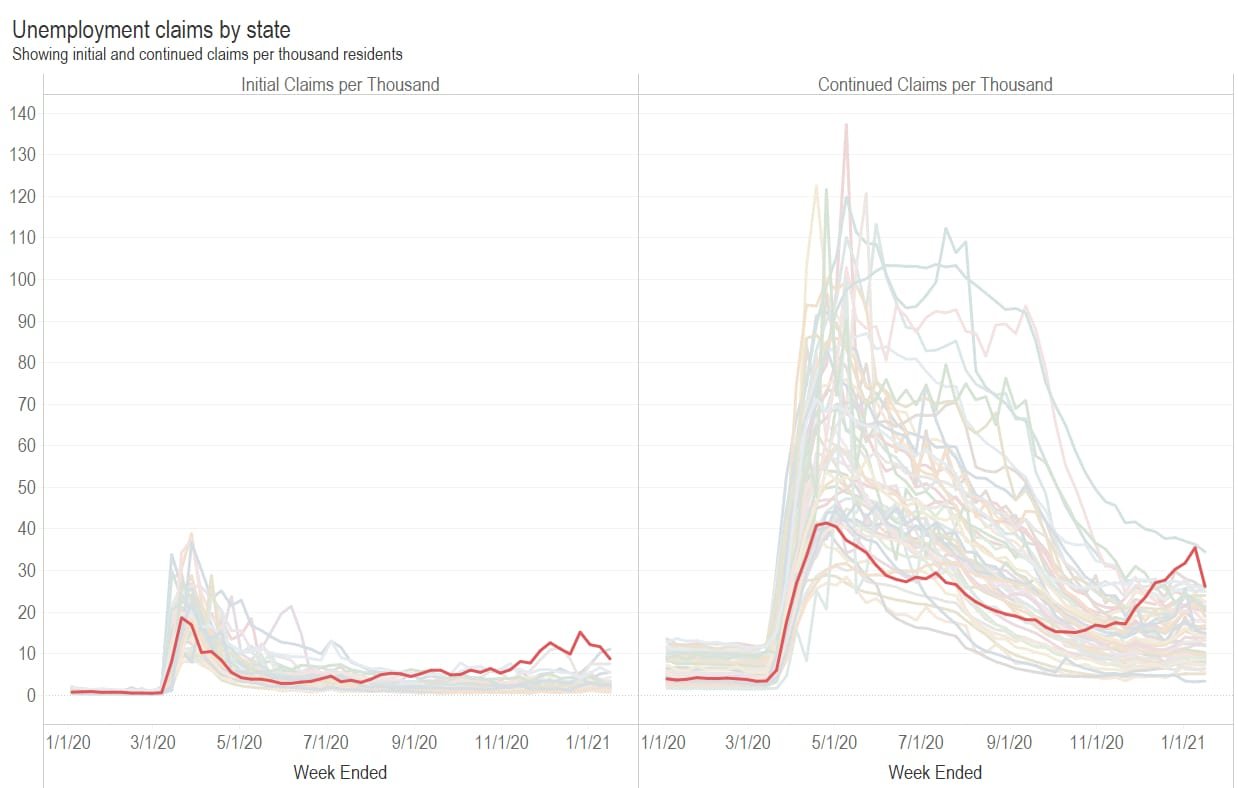
Kansas unemployment claims trending lower
Read more: Kansas unemployment claims trending lowerA visualization of unemployment insurance claims by state, adjusted for population, shows Kansas as having a high number of claims, but trending lower.
-
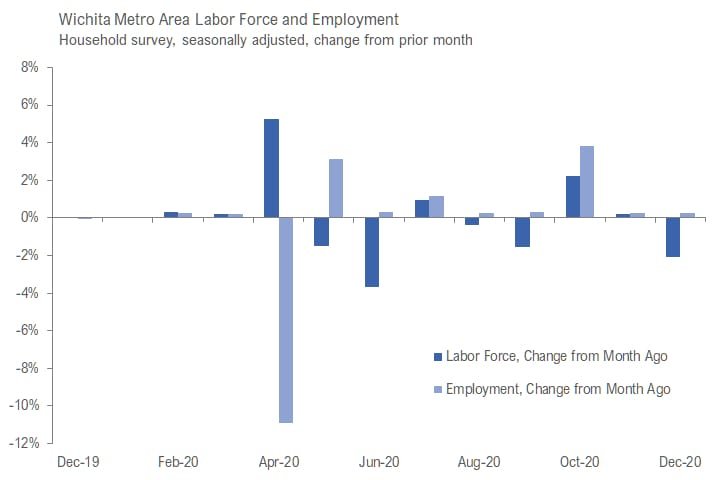
Wichita jobs and employment, December 2020
Read more: Wichita jobs and employment, December 2020For the Wichita metropolitan area in December 2020, the number of unemployed persons is up, the unemployment rate is up, and the number of people working is down when compared to the same month one year ago. The recent trend, however, is mixed.
-
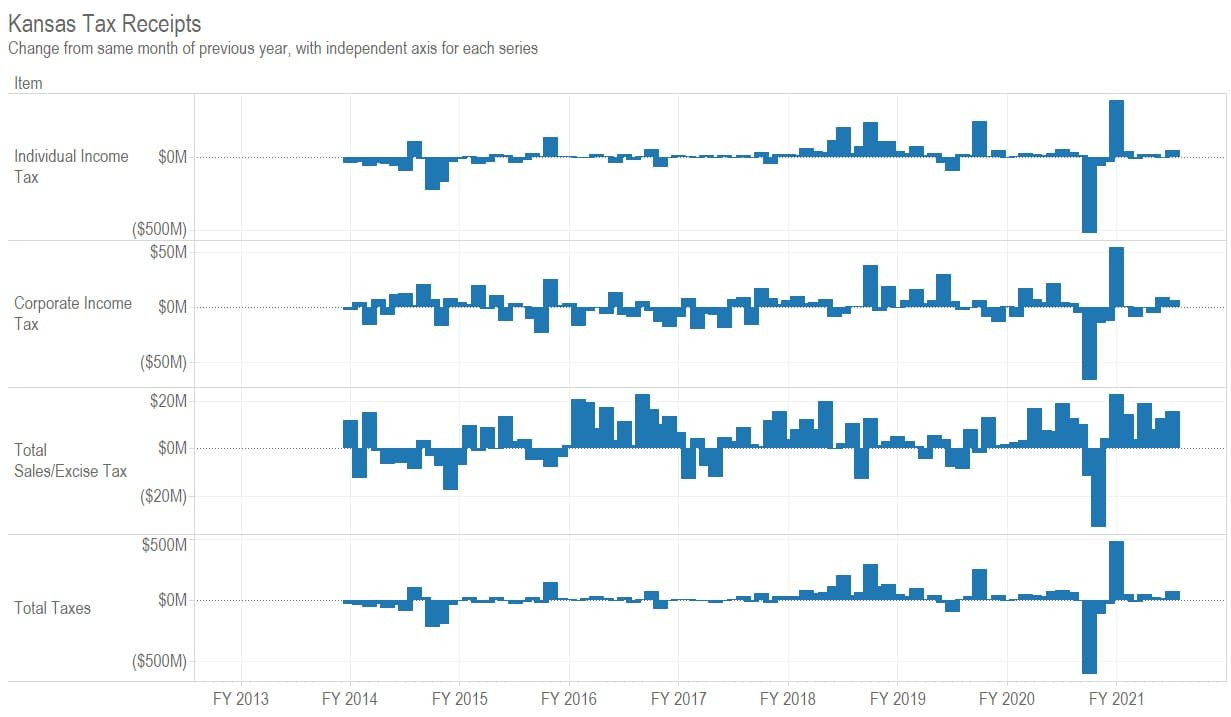
Kansas tax revenue, January 2021
Read more: Kansas tax revenue, January 2021For January 2021, total Kansas tax revenue was 9.7 percent greater than January 2020. Over the seven months of the current fiscal year, tax revenue is 15.5 percent higher than at the same point of the previous fiscal year.
-

Follow the Money
Read more: Follow the Money“Put another way: We all pay taxes together. Like it or not. Any time a politician tells you he is going to raise taxes but only on other people, he is selling snake oil. The truth is, politicians don?t know where taxes actually land. Nobody really does ? and nobody but nobody knows in advance…
-

Newsletter for January 31, 2021
Read more: Newsletter for January 31, 2021Here is your fresh edition of the newsletter from Voice For Liberty. This edition is dated January 31, 2021.
-
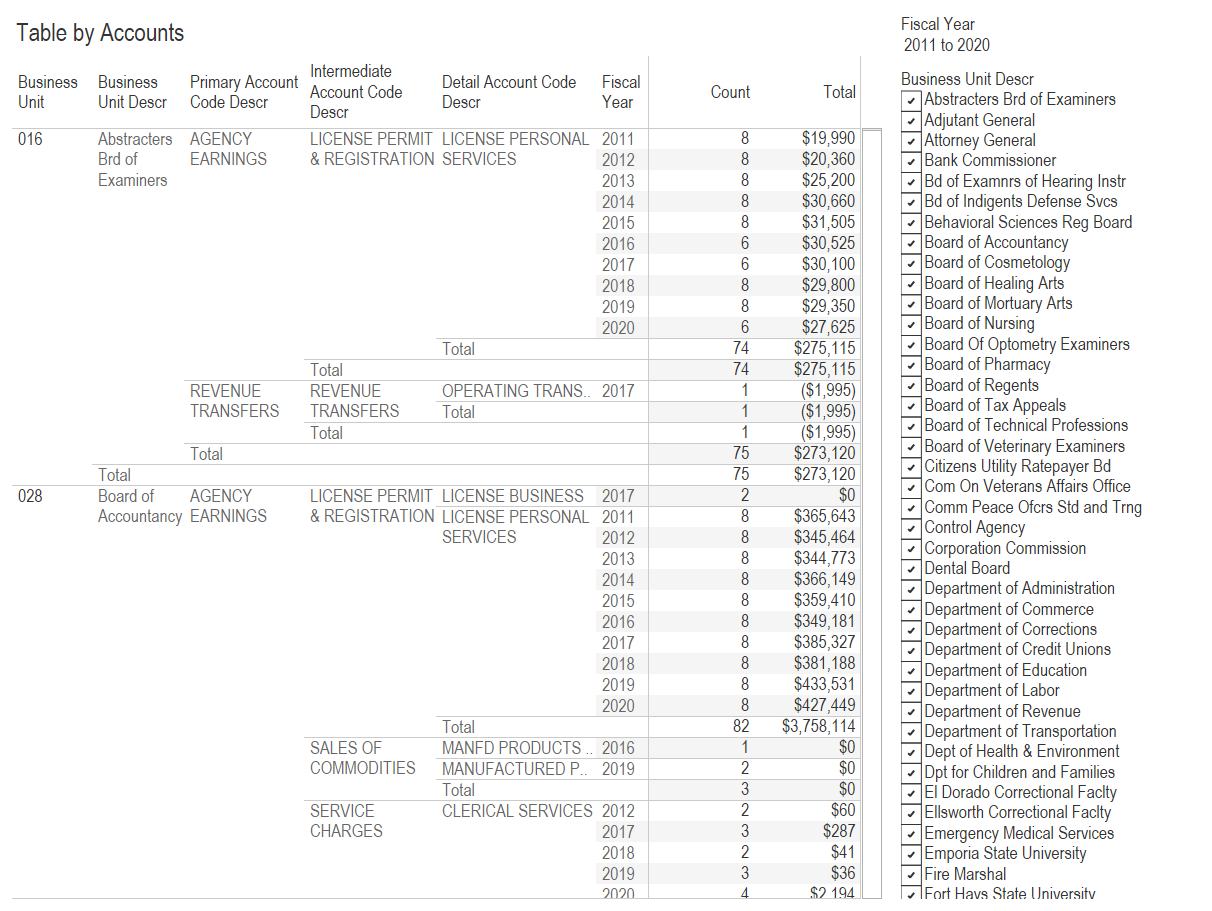
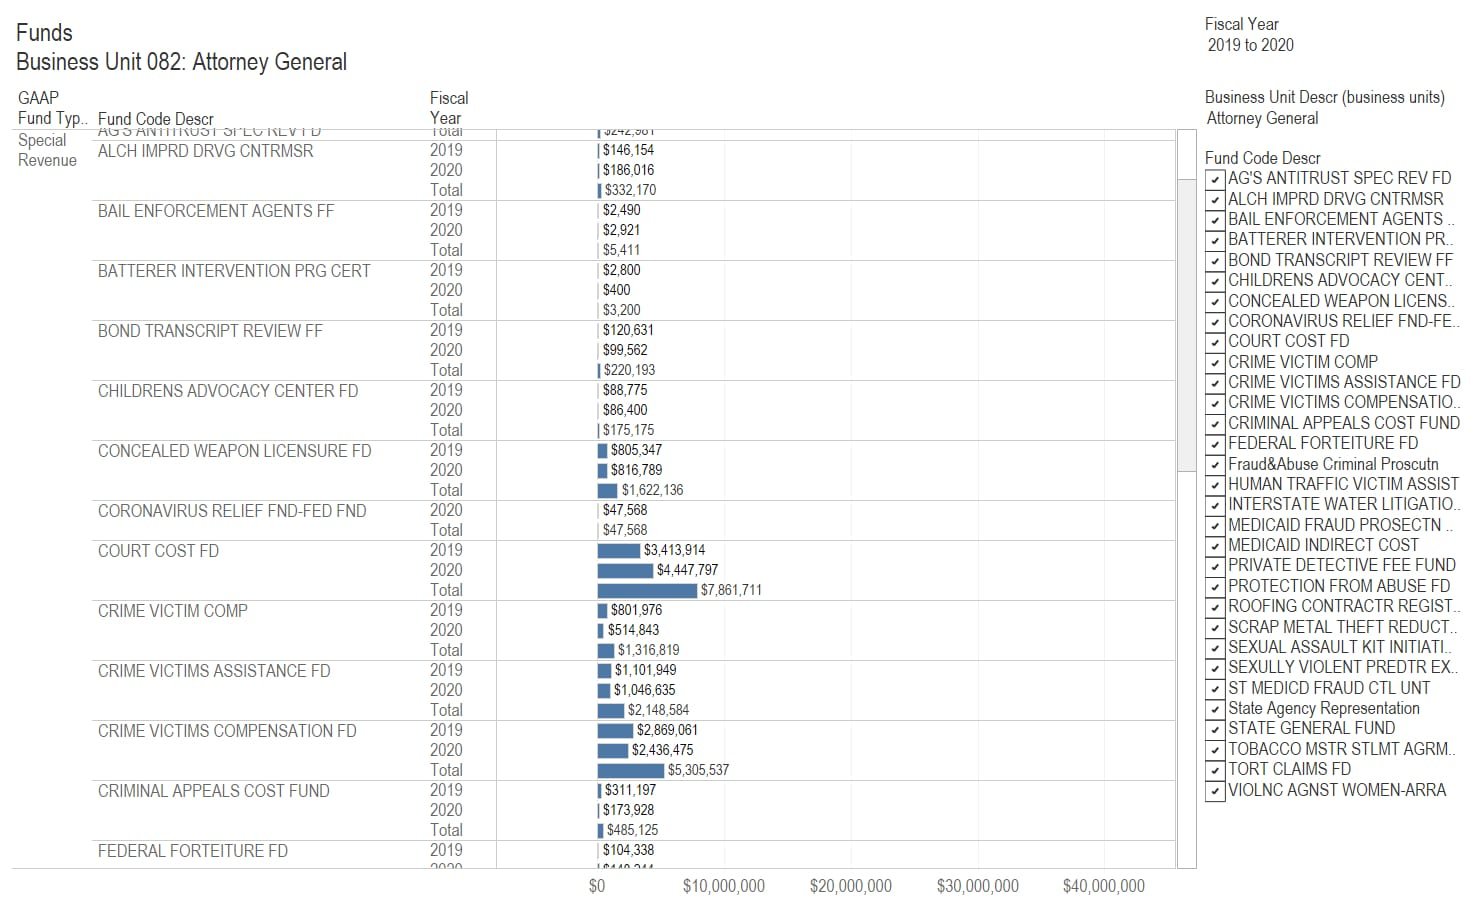
Kansas agency revenue
Read more: Kansas agency revenueData regarding State of Kansas agency revenue presented in an interactive visualization, with data through fiscal year 2020.
-
Kansas agency expenditures
Read more: Kansas agency expendituresData regarding State of Kansas agency spending presented in an interactive visualization, with data through fiscal year 2020.