Tag: Economic development
-

Wichita City Council to consider a clawback
The unrealized potential of an economic development incentive teaches lessons.
-
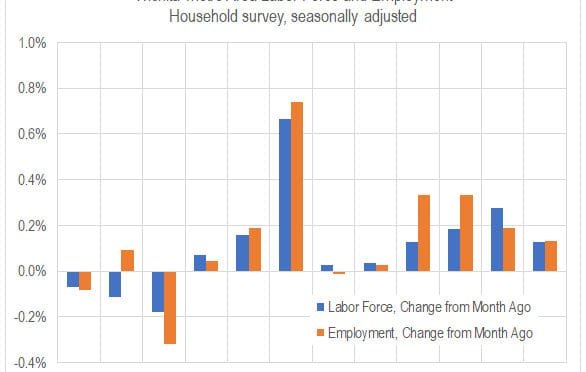
Wichita employment, November 2018
For the Wichita metropolitan area in November 2018, jobs are up, the labor force is up, and the unemployment rate is down, compared to the same month one year ago. Seasonal data shows a slowdown in the rate of job growth.
-

Starlite loan isn’t needed
The Wichita City Council seems poised to enter an unnecessarily complicated transaction.
-

Sedgwick County tax exemptions
Unlike the City of Wichita, Sedgwick County has kept track of its tax exemptions.
-
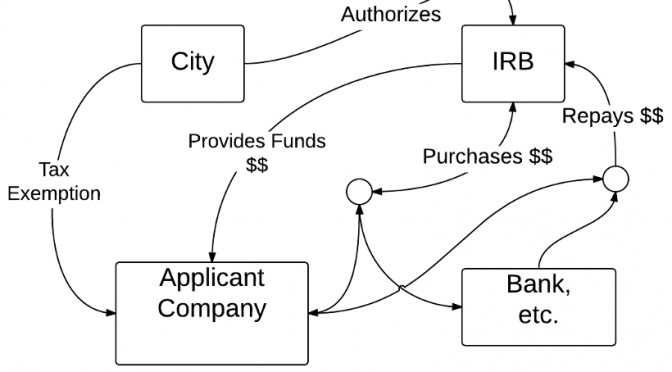
It’s not the bonds, it’s the taxes
A Wichita Eagle headline reads “Wichita aircraft supplier plans 45 new jobs with $7.5 million bond request,” but important information is buried and incomplete.
-
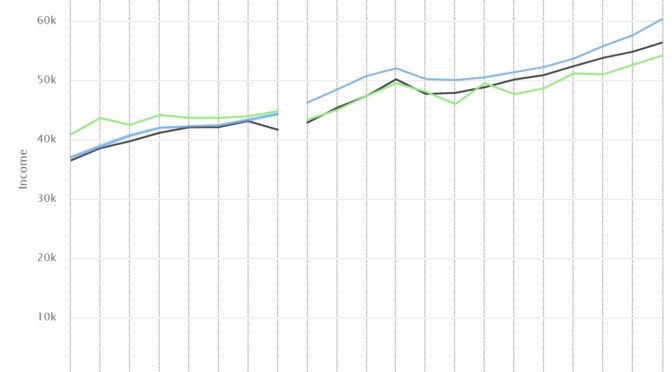
Sedgwick County income and poverty
Census data show Sedgwick County continues to fall behind the nation in two key measures.
-
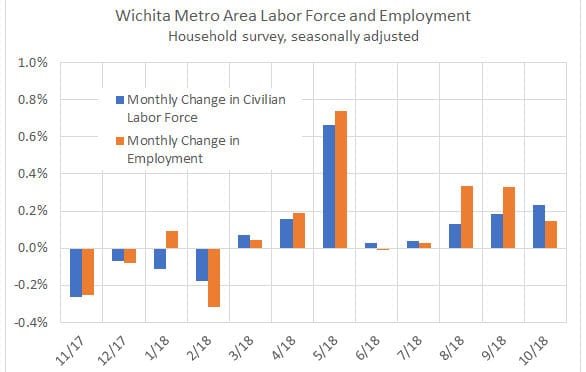
Wichita employment, October 2018
For the Wichita metropolitan area in October 2018, jobs are up, the labor force is up, and the unemployment rate is down, compared to the same month one year ago. Seasonal data shows a slowdown in the rate of job growth.
-

WichitaLiberty.TV: Economic development incentives
A look at some economic development incentive programs in Wichita and Kansas. Second in a series. Tax increment financing (TIF) is prominent in this episode.
-

Sedgwick County jobs, second quarter 2018
For the second quarter of 2018, the number of jobs in Sedgwick County grew slightly slower than the nation.
-

WichitaLiberty.TV: Economic development incentives
A look at some economic development incentive programs in Wichita and Kansas. First in a series.
-
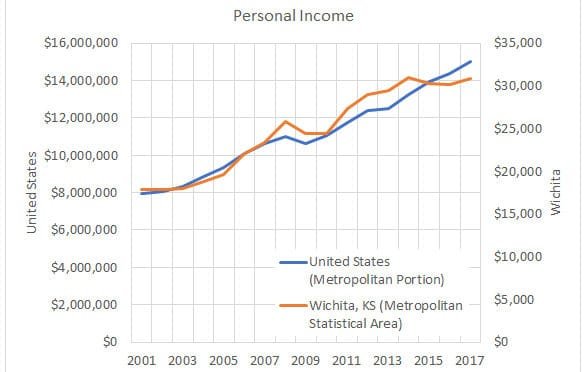
Personal income in Wichita rises, but slowly
For 2017, personal income in Wichita rose, but slower than the national rate.
-
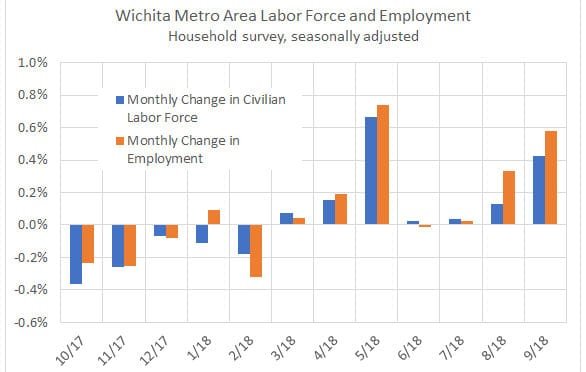
Wichita employment, September 2018
For the Wichita metropolitan area in September 2018, jobs are up, the labor force is up, and the unemployment rate is down, compared to the same month one year ago.