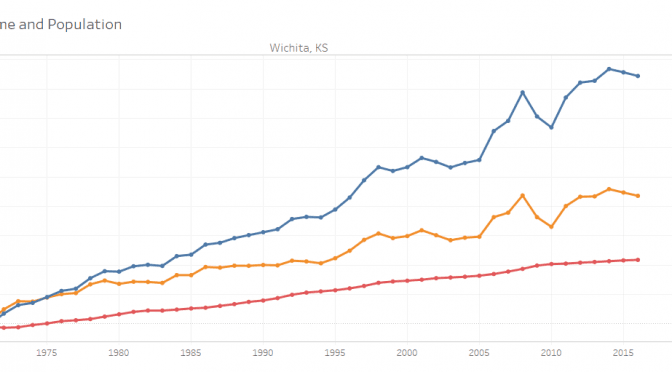
For 2016, personal income in Wichita rose, but is still below 2014 levels.
The Bureau of Economic Analysis, an agency of the United States Department of Commerce, has released personal income figures for metropolitan areas through 2016. For the Wichita metropolitan statistical area, personal income in 2016 rose slightly from 2015 level, but is still below the 2014 level. In real (inflation-adjusted) dollars, personal income fell in 2016.
Click for larger.
The trend in personal income mirrors that of the Wichita-area GDP, which is the value of goods and services produced. That fell in 2016. 1
To access an interactive visualization of personal income for all metropolitan areas, click here.
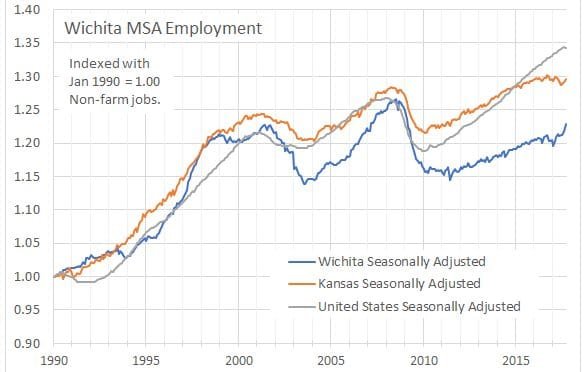
Employment in the Wichita metropolitan area is on an upward tick.
Wichita MSA employment. Click for larger.Using seasonally-adjusted figures, employment in the Wichita Metropolitan Statistical Area 1 was 294,800 in January 2017. For September, it is 302,700, an increase of 7,900, or 2.7 percent. This data is from the Bureau of Labor Statistics, part of the United States Department of Labor. 2
Wichita MSA employment. since 2010 Click for larger.The employment data comes from the BLS Current Employment Statistics program, which surveys employers. 3
BLS also collects data regarding employment and unemployment through the Local Area Unemployment Statistics (LAUS) program. 4 It is part of the Bureau’s Current Population Survey (CPS), which is a “monthly survey of households conducted by the Bureau of Census for the Bureau of Labor Statistics.” 5 This data is collected from a survey of households, and the monthly data is not adjusted for seasonality. This is the data series that produces the oft-cited unemployment rate.
It’s important to understand the nature of the unemployment rate. Being a ratio, it has two moving parts, specifically the number of unemployed people and the number of people in the labor force. (The labor force, broadly, is the number of persons working plus those actively looking for work.)
It is possible that the unemployment rate falls while the number of people employed falls or rises slowly. This is the general trend in Wichita for the past seven years or so. The nearby table illustrates this. Because the values in this data series are not adjusted for seasonality, I use the average of the proceeding 12 months.
In the first example, the unemployment rate fell by nearly half for the time period chosen. (2010 was the first full year after the most recent recession ended.) That improvement was produced by a small increase in the number of employed people and a large decline in the labor force. Is our area better off for this? Local politicians and bureaucrats seem to think so, as the low unemployment rate is widely cited as a measure of their success in managing the local economy.
The second example uses as its starting point 2008, which was the high mark for employment in the Wichita MSA. The unemployment rate then is nearly the same as today. But both the labor force and the number of employed persons is down.
If we consider only the unemployment rate, it looks like the Wichita area is prospering. But the unemployment rate hides bad news.
In the nearby chart you can see these effects. The unemployment rate has been declining, although it has recently increased slightly. The labor force has been declining. The number of employed persons has increased, although it has also recently declined.
Wichita MSA employment and labor force. Click for larger.Wichita MSA unemployment rate. Click for larger.
The labor force, specifically the civilian labor force, are those people working, plus those people actively searching for work, minus people under 16 years of age, minus people living in institutions (for example, correctional facilities, long-term care hospitals, and nursing homes), minus people on active duty in the Armed Forces.
BLS defines unemployed people as: “Persons aged 16 years and older who had no employment during the reference week, were available for work, except for temporary illness, and had made specific efforts to find employment sometime during the 4-week period ending with the reference week. Persons who were waiting to be recalled to a job from which they had been laid off need not have been looking for work to be classified as unemployed.”
The unemployment rate is “the number unemployed as a percent of the labor force.”
Bureau of Labor Statistics. Glossary. Available at https://www.bls.gov/bls/glossary.htm. ↩
“The Bureau of Labor Statistics (BLS) has two monthly surveys that measure employment levels and trends: The Current Population Survey (CPS), also known as the household survey, and the Current Employment Statistics (CES) survey, also known as the payroll or establishment survey.
Both surveys are needed for a complete picture of the labor market.
The payroll survey (CES) is designed to measure employment, hours, and earnings in the nonfarm sector, with industry and geographic detail. The survey is best known for providing a highly reliable gauge of monthly change in nonfarm payroll employment. A representative sample of businesses in the U.S. provides the data for the payroll survey.
The household survey (CPS) is designed to measure the labor force status of the civilian noninstitutional population with demographic detail. The national unemployment rate is the best-known statistic produced from the household survey. The survey also provides a measure of employed people, one that includes agricultural workers and the self-employed. A representative sample of U.S. households provides the information for the household survey.
National employment estimates from both the household and payroll surveys are published in the Employment Situation news release each month. The estimates differ because the surveys have distinct definitions of employment and distinct survey and estimation methods.” Bureau of Labor Statistics. Comparing employment from the BLS household and payroll surveys. Available at https://www.bls.gov/web/empsit/ces_cps_trends.htm. ↩
Bureau of Labor Statistics. Local Area Unemployment Statistics (LAUS) program. Available at https://www.bls.gov/lau/. ↩
In this episode of WichitaLiberty.TV: Sedgwick County Commissioner Richard Ranzau joins Karl Peterjohn and Bob Weeks to discuss Sedgwick County government issues, including allegations of misconduct by a commission member and the possibility of a Tyson chicken plant. View below, or click here to view at YouTube. Episode 172, broadcast November 11, 2017.
Wichita economic development officials use a circuitous method of estimating the population of downtown Wichita, producing a number much higher than Census Bureau estimates.
Recently the Wichita Business Journal reported:
Getting more people to live in the core was clearly one of the most important tasks for the city. Back in 2010, the report said downtown Wichita was ripe for an additional 1,000 housing units.
That goal seems to have been met. According to a recent report from the group Downtown Wichita, 835 residential units have been completed since 2010. An additional 742 units are in development downtown, where about 2,100 people live today. 1
The report referred to is the 2017 State of Downtown Report. 2 While this report highlights the number of people living in downtown Wichita, it no longer reports the number of people working in downtown. 3
How does Downtown Wichita arrive at the number of residents in downtown? An endnote from the report gives the details:
The 2010 U.S. Census states the population in the 67202 area code is 1,393. Per Downtown Wichita records, 702 units rental units have opened in the Downtown SSMID district since 2010 when the Census was taken. Per data provided directly from the Downtown residential rental properties, the absorption rates of the market rate units has an average of 85%. Per the U.S. Census Bureau, 2011-2015 American Community Survey 5-Year Estimates, the average size of renter-occupied units is 1.25 persons. Therefore, an estimate for the current population is 2,138. 4
What DW has done is to take a reliable figure (the 2010 decennial census) and extrapolate forward to 2016. (Presumably 2016, as the report doesn’t say.)
But there are a few issues, as follows:
First, the calculation includes 702 rental units that have opened since 2010. Have any rental units closed since then? That would be good to know. Curious is that the report prominently mentions “835 units completed since 2010.” There have been condominiums that have opened since 2010. Why would DW use only rental units in its calculation?
Second, the DW calculation makes use of two estimates, absorption rate 5 and size of renter-occupied units. (What about size of owner-occupied units?) Each of these is an estimate that has its own error probabilities, and those errors compound when multiplied.
Third, there is no need to go through this roundabout calculation, as the Census Bureau has provided an estimate for the population of downtown in 2015. Data from the American Community Survey 6 estimates that the population in downtown Wichita for 2015 was 1,438, with a 90 percent confidence interval of plus or minus 242. 7 This means the Census Bureau is confident the population of downtown Wichita in 2015 was in the range of 1,196 to 1,680, that confidence factor being 90 percent.
But DW says the population of downtown is 2,138, which is far — really far — outside the range the Census Bureau gives for the 2015 population. While DW’s population estimate is probably for 2016, it still lies far outside the range of probability, based on Census Bureau estimates.
It’s really curious that DW doesn’t use the Census Bureau estimate of population. That population estimate comes directly from the Bureau’s American Community Survey 5-Year Estimates for 2011 to 2015. DW didn’t use that number, but it relied on the same body of data to get “average size of renter-occupied units” for 2015.
Why would DW use the Census Bureau for one datum but not another, especially when the Census Bureau data reports the statistic DW is trying on its own to estimate in a roundabout manner?
It’s simple. DW’s calculations produce 2,138 people living in downtown. The Census Bureau estimate is a much smaller number: 1,438.
By the way, DW’s calculations start with the 2010 Census Bureau population for downtown. Of the downtown population of 1,393 that year, 253 were men living in institutions like the Kansas Department of Corrections Wichita Work Release facility at Emporia and Waterman Streets. It has a capacity of 250. 8
“Absorption is the amount of space or units leased within a market or submarket over a given period of time (usually one year). Absorption considers both construction of new space and demolition or removal from the market of existing space.” Institute of Real Estate Management. Calculating Absorption. Available at https://www.irem.org/education/learning-toolbox/calculating-absorption. ↩
U.S. Census Bureau, 2011-2015 American Community Survey 5-Year Estimates ↩
The new State of Downtown Wichita report for 2017 is missing something. What is it, and why is it missing?
Recently the Wichita Business Journal reported:
When you’re Jeff Fluhr, you don’t spend much time in park — it’s usually full speed ahead.
It was no different when a couple of members of the Wichita Business Journal’s newsroom visited with the president of Downtown Wichita and the Greater Wichita Partnership in early October.
On this day, Fluhr was excited to pass out copies of the 42-page 2017 “State of Downtown” report, which had just been released. 1
The new report is something better than before. 2 Actually, it’s what is left out that marks a step forward for Downtown Wichita, which is the new name for the Wichita Downtown Development Corporation.
Downtown Wichita brochure.Previous versions of the report prominently mentioned the number of daytime workers in downtown Wichita. 3The number most often given was 26,000. But that number is missing from this year’s report. Unless I overlooked it, there is no mention of the number of workers in downtown Wichita.
Why was this number omitted from this year’s report? Earlier this year I found out that the U.S. Census Bureau data series which was the source of this statistic is not a valid measure of the number of people working downtown. That’s because the series counts all the employees of the Wichita public school district as downtown workers solely because the district’s headquarters building is downtown.4 This means the statistic is not valid and meaningful, because most school workers don’t work at the downtown building. Instead, they’re working in schools and other facilities dispersed throughout the district. A similar anomaly exists for Wichita city workers: All are counted as though they work in the city hall building. 5
When I asked Jeff Fluhr, the president of Downtown Wichita, about this he referred my question to Jeremy Hill, the Director of Center for Economic Development and Business Research at Wichita State University. This was — seemingly — reasonable as CEDBR supplied the number to Fluhr’s organization. Hill’s response was unsatisfactory in resolving the issue. In conclusion, Hill wrote to me: “Although the center systematically questions all data sources (federal, state, private, and nonprofit) for reasonableness, limited resources (e.g. time and costs) prevent us from validating and/or cross checking every statistic. In this situation, the center used the appropriate source for the research question and the total number of people estimated to work downtown was within reason.”
The Census Bureau OnTheMap application for downtown Wichita, zip code 67202. Click for larger.LODES data for census block 201730043001036, showing 7,740 workers.Here’s what concerns me. This data comes from a Census Bureau application called “OnTheMap.” When using the OnTheMap application for downtown Wichita, which is zip code 67202, there are two large bright blue dots that stand out from all others. These represent the two highest concentrations of workers in downtown Wichita. One is Census block 201730043001036, which has 7,740 employees. This is a one square block area from First to Second Streets, and Wichita to Water Streets. That block, for the year of this data, held the Wichita school district headquarters building.
7,740 employees is a lot. It’s about one-fourth of the total downtown employee count claimed by Downtown Wichita and CEDBR. It’s more employees than McConnell Air Force Base has, and about twice as many that work at Koch Industries in Wichita.
Importantly, this number is eleven times the number that work at Cargill, a company which Wichita is granting many millions of dollars in incentives just to retain the company in Wichita.
Promotional material on the former Henry’s building. Click for larger.We just have to wonder: Didn’t anyone look at this data in a serious and critical manner? A quick glance at the data by CEDBR, much less “systematically” checking for “reasonableness” should have led to questions. A quick look by Downtown Wichita staff should have spurred these inquiries: Who do all these people work for in that one block? This is a wonderful success story! How can we replicate this great accomplishment in other blocks in downtown Wichita?
And didn’t anyone at the City of Wichita — council members and bureaucrats alike — wonder about these numbers?
That didn’t happen. Or maybe it did, and someone in authority nonetheless decided to proceed to use a statistic that doesn’t mean what city leaders say it means.
That’s why I wrote it was seemingly reasonable for Fluhr to refer me to CEDBR with my questions about the data. In retrospect, it is clear this is a multi-year episode of incompetence, ineptitude, or dishonesty.
But at least this statistic is no longer used.
I asked Cindy Claycomb, who is Chair of the Executive Committee of Downtown Wichita, about this. She replied that all data sources are listed in the report, and that the board relies on the expertise of the Wichita Downtown Development Corporation staff to decide what is presented in each year’s report. She said Jeff Fluhr was the best person to address my concerns. He, as we saw, demurred to CEDBR at WSU.
(By the way, Claycomb is nearly certain to be elected to the Wichita City Council in November. Jeff Fluhr is now, besides president of Downtown Wichita, also president of Greater Wichita Partnership, the new organization regional governments rely on for economic development.)
Trends of business activity in downtown Wichita. Click for larger.So: How many jobs are in downtown Wichita? There is another series of census data that is better, but not perfect, as it counts private-sector employees only. That data shows 13,581 workers in downtown Wichita for 2015. 6 But what’s remarkable — and disappointing — about this data series is its trend: It’s going down. The recent peak was 16,658 workers in 2008. By 2015 that number was down by 18 percent. (Again, these are private sector workers only.)
In summer 2017 the district moved its headquarters away from downtown to the former Southeast High School. It will be a few years before this is reflected in Census Bureau data. ↩
Wichita considers hiring a consultant to help find a baseball team.
In August the Wichita Eagle reported:
Wichitans can hope for an announcement on a new affiliated baseball team coming to Wichita by the end of 2017, Mayor Jeff Longwell says.
“By the end of this calendar year, we feel confident that we will be able to announce a team, who the team is, all of the above,” Longwell told The Eagle Tuesday afternoon. “We hope that we can complete all of those conversations by the end of this year and be able to announce a contract in place.” 1
Evidently the mayor and the city are feeling less confident. Next week’s city council agenda includes a proposal to hire a consulting firm to help the city. The contract the council will consider states: “Wichita desires to retain Beacon Sports as its advisor and exclusive representative for the Assignment, and perform such other advisory services as are mutually agreed upon between the two parties.” 2
The city’s analysis advises: “Based on the encouraging findings, City staff have reached the conclusion that, due to Minor League Baseball (MiLB) rules and protocols, it is necessary to formally contract with a specialized baseball consultant.”
The contract has a cap of $50,000. For this, the contract states, “Beacon Sports will use its best efforts and endeavor to assist Wichita in obtaining and having present to it qualified offers on terms that are acceptable to Wichita, but makes no representation regarding the successful outcome of this Assignment.”
Of note, this item appears on the consent agenda. That’s a collection of agenda items that are voted on in bulk, with one single vote, unless a council member requests an item be “pulled” for discussion and possibly a separate vote. Generally, items on consent agendas are not controversial, and it may hold two dozen or more items.
Kansas hotel guest tax collections presented in an interactive visualization.
Cities and counties in Kansas may levy a transient guest tax collection on hotel guests. It is sometimes called a bed tax or guest tax. The tax is collected as a percentage of total room revenue, not the number of rooms or the rate charged for rooms. While the Kansas Department of Revenue collects the tax, the proceeds are returned to the cities or counties, except for a two percent processing fee. In Wichita the rate is six percent.
In some cases, jurisdictions may levy additional taxes that may not be paid to the Kansas Department of Revenue. This is the case with the Wichita city tourism fee, which took effect on January 1, 2015. This tax of 2.75% is paid directly to the city1, so it doesn’t appear in KDOR figures.
Also, jurisdictions may change the tax rate. The Kansas Department of Revenue maintains a list of taxes charged. 2
The visualization has three views of data. One is a table of collections, including percent change from the previous year. A line chart shows the dollar amount of collections. A second line chart shows collections indexed to a common starting point. This is useful for comparing the relative change in guest tax collections. These line charts show data as the average of the previous 12 months.
Examples of nondisclosure.This data does not represent all hotels in Kansas. Confidentiality rules prohibit disclosure when a jurisdiction has a small number of hotels. In the nearby example, the value “C” is reported for Sedgwick County, indicating such non-disclosure. Obviously, there are hotels in Sedgwick County. But considering hotels in Sedgwick County that are not located in cities like Wichita, the number is too small to report, based on confidentiality guidelines. Similarly, for small cities, data is probably not available to the public.
Of note, while Wichita is the largest city in Kansas, Overland Park collects the most hotel guest tax. Of the largest markets in Kansas, Wichita has experienced the least growth in hotel tax collections since 2010.
In this episode of WichitaLiberty.TV: Karl Peterjohn and Bob Weeks continue discussing Century II, Wichita’s convention and performing arts center. But first, some unfortunate economic news for Wichita. View below, or click here to view at YouTube. Episode 166, broadcast September 24, 2017.
Video of Heywood Sanders, author of Convention Center Follies, speaking in Kansas City. The introduction is lengthy but worthwhile. Prof. Sanders starts speaking at the 19 minute mark.
Article: Wichita about to commit to more spending. Bigly. This week the Wichita City Council considers hiring a consulting firm to develop plans for a new performing arts and convention center.
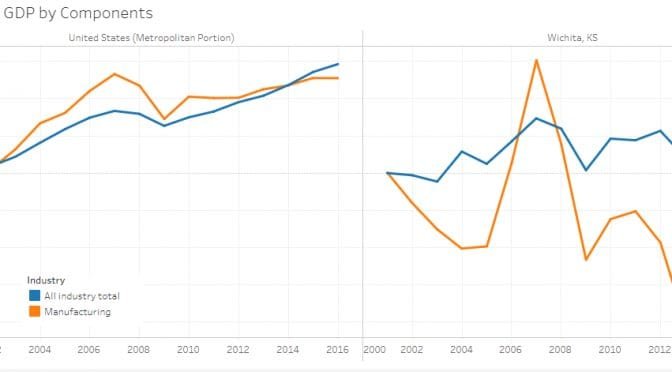
The Wichita-area economy was smaller in 2016 than the year before.
The Wichita MSA economy produced fewer goods and services in 2016 than in 2015, according to data from the Bureau of Economic Analysis, which is part of the U.S. Department of Commerce.
In real (inflation-adjusted) dollars, the Wichita metropolitan area gross domestic product fell by 1.4 percent. For all metropolitan areas, GDP grew by 1.7 percent.
Since 2001, GDP for all metropolitan areas grew by 29.3 percent, while Wichita had 12.3 percent growth.
BEA offers these definitions:
Gross domestic product (GDP) by metropolitan area is the sub-state counterpart of the Nation’s gross domestic product (GDP), the Bureau’s featured and most comprehensive measure of U.S. economic activity. GDP by metropolitan area is derived as the sum of the GDP originating in all the industries in the metropolitan area.
Gross domestic product (GDP) is the value of the goods and services produced by the nation’s economy less the value of the goods and services used up in production. GDP is also equal to the sum of personal consumption expenditures, gross private domestic investment, net exports of goods and services, and government consumption expenditures and gross investment.
Current-dollar statistics are valued in the prices of the period when the transactions occurred–that is, at “market value.” Also referred to as “nominal GDP” or “current-price GDP.”
Real values are inflation-adjusted statistics–that is, these exclude the effects of price changes.


 In the first example, the unemployment rate fell by nearly half for the time period chosen. (2010 was the first full year after the most recent recession ended.) That improvement was produced by a small increase in the number of employed people and a large decline in the labor force. Is our area better off for this? Local politicians and bureaucrats seem to think so, as the low unemployment rate is widely cited as a measure of their success in managing the local economy.
 The second example uses as its starting point 2008, which was the high mark for employment in the Wichita MSA. The unemployment rate then is nearly the same as today. But both the labor force and the number of employed persons is down.