Tag: Economic development
-
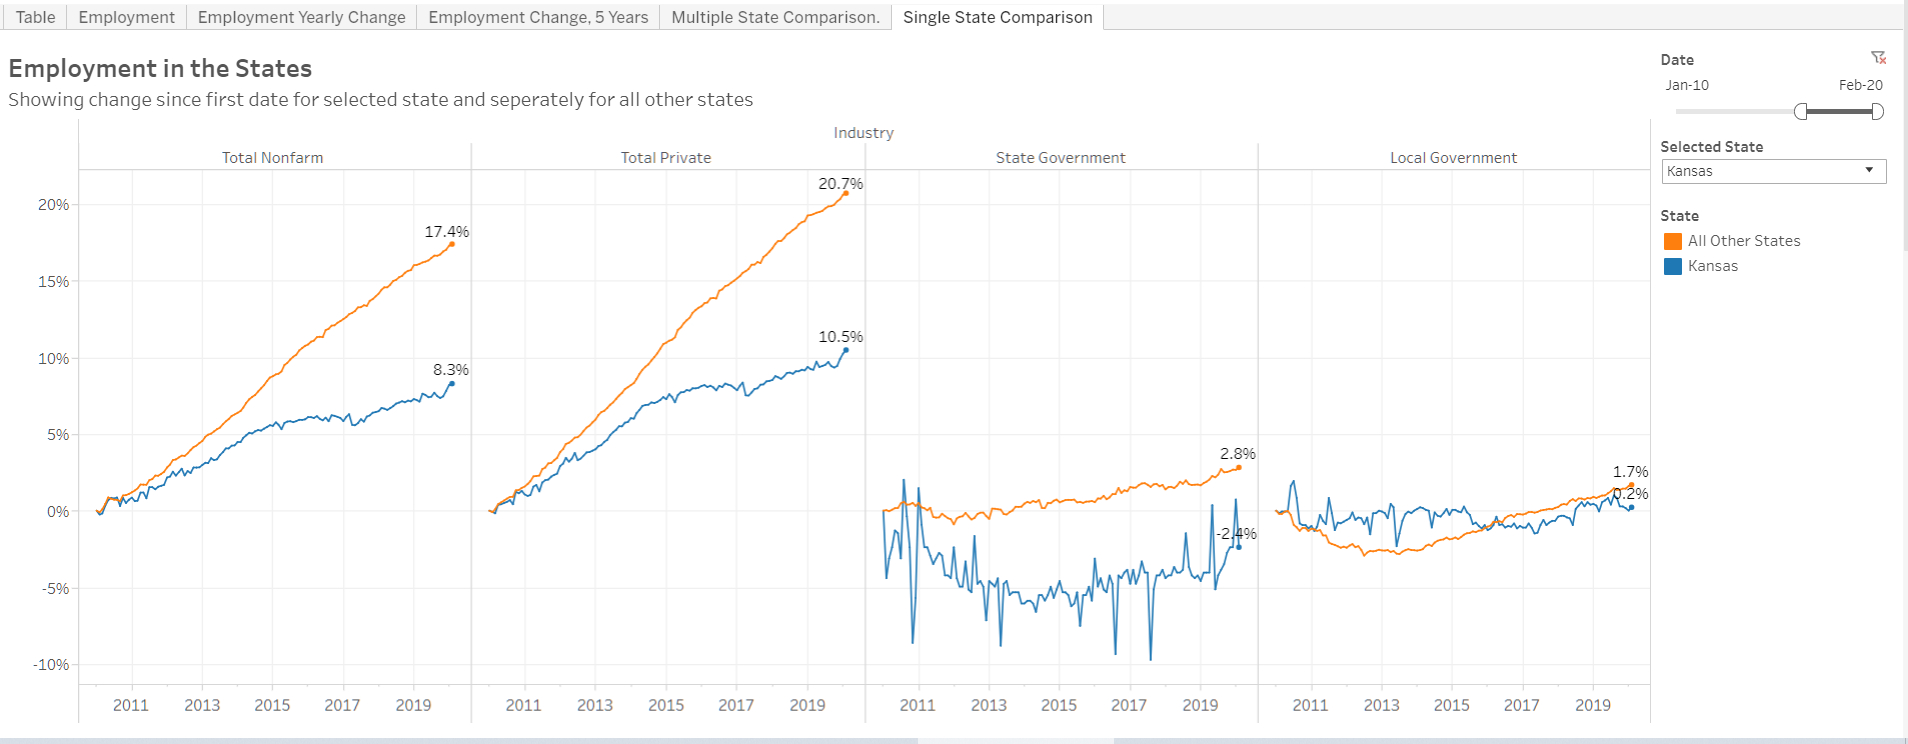
Employment in the states
An interactive visualization of monthly employment in the states by major industry category.
-

Wichita jobs and employment, April 2020
For the Wichita metropolitan area in April 2020, the number of unemployed persons is up, the unemployment rate is up, and the number of people working is down, all by large amounts, when compared to the same month one year ago. Seasonal data shows the same trend.
-

Wichita presents industrial revenue bonds
A presentation by the City of Wichita regarding IRBs is good as far as it goes, which is not far enough.
-

Wichita needs transparency from its agencies
When the Wichita city council delegates spending to outside agencies such as Visit Wichita, it should insist on the same transparency requirements the city itself faces.
-

Wichita city council to address misunderstanding
The Wichita city council will address a misunderstanding regarding imprecise language in an economic development incentive agreement.
-

Wichita jobs and employment, March 2020
For the Wichita metropolitan area in March 2020, the labor force is up, the number of unemployed persons is up, the unemployment rate is down, and the number of people working is up when compared to the same month one year ago. Seasonal data shows increases in labor force and jobs from February, with the…
-
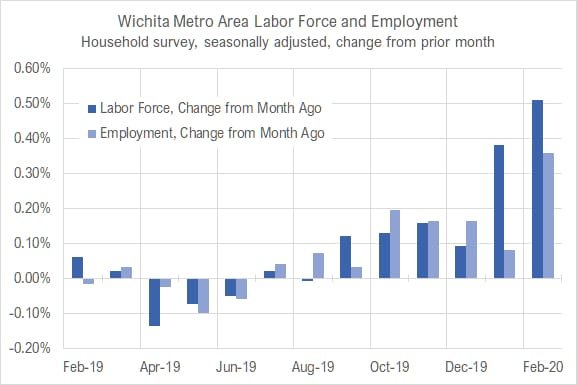
Wichita jobs and employment, February 2020
For the Wichita metropolitan area in February 2020, the labor force is up, the number of unemployed persons is up, the unemployment rate is up, and the number of people working is up when compared to the same month one year ago. Seasonal data shows increases in labor force and jobs from January.
-

Freestanding emergency room in Wichita closes
The conversion of a medical facility should receive city scrutiny due to tax breaks granted based on its original use.
-

Wichita jobs and employment, January 2020
For the Wichita metropolitan area in January 2020, the labor force is up, the number of unemployed persons is down, the unemployment rate is down, and the number of people working is up when compared to the same month one year ago. Seasonal data shows increases in labor force and jobs from December.
-

Intrust Bank Arena economic impact holds mistake
A report on the economic impact of the first ten years of operation of the Intrust Bank Arena in downtown Wichita incorrectly reported tax revenue.
-
The Reality of Economic Development Incentives
Patrick Tuohey spoke to the Wichita Pachyderm Club February 21, 2020, on “The Reality of Economic Development Incentives: Lessons from Kansas City and Elsewhere.”
-

Missing from Wichita city documents: Sales tax
It would be simple for the City of Wichita to include additional relevant information regarding economic development incentive decisions.