Tag: Economics
-

Kansas jobs, September 2018
For September 2018, more jobs in Kansas than last September, but fewer than in August.
-
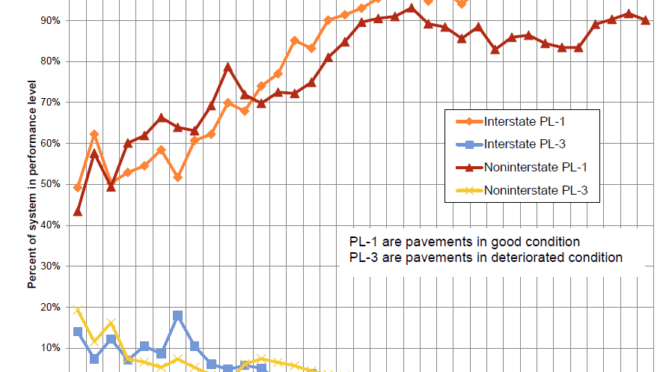
Kansas highway pavement conditions
What is the condition of Kansas highways?
-

From Pachyderm: Economic development incentives
A look at some of the large economic development programs in Wichita and Kansas.
-
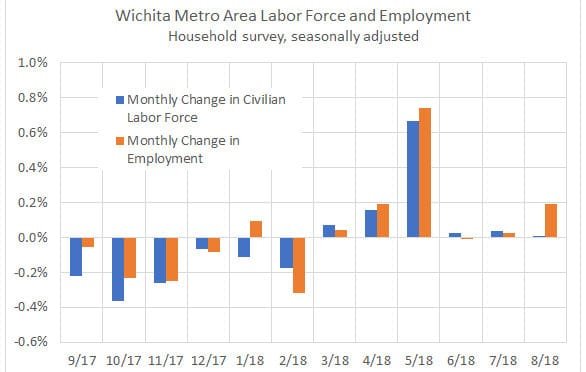
Wichita employment, August 2018
For the Wichita metropolitan area in August 2018, jobs are up, the unemployment rate is down, and the labor force is smaller, compared to the same month one year ago.
-

Kansas agriculture and the economy
What is the importance of agriculture to the Kansas economy?
-

Kansas and Wichita jobs, August 2018
For August 2018, more jobs in Kansas, and a nearly unchanged labor force. Wichita jobs also rose.
-
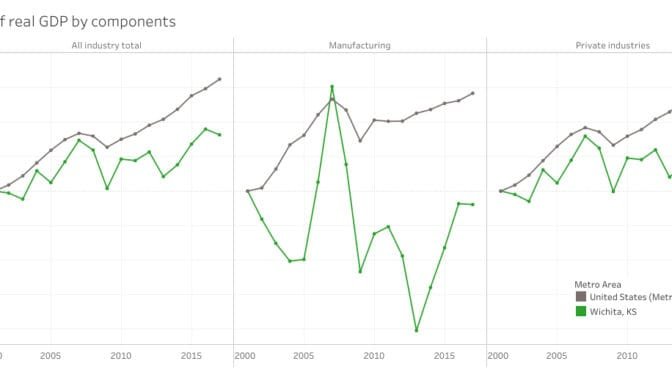
GDP by metropolitan area and component
An interactive visualization of gross domestic product by metropolitan area and industry.
-

Wichita economy shrinks, and a revision
The Wichita economy shrank in 2017, but revised statistics show growth in 2016.
-
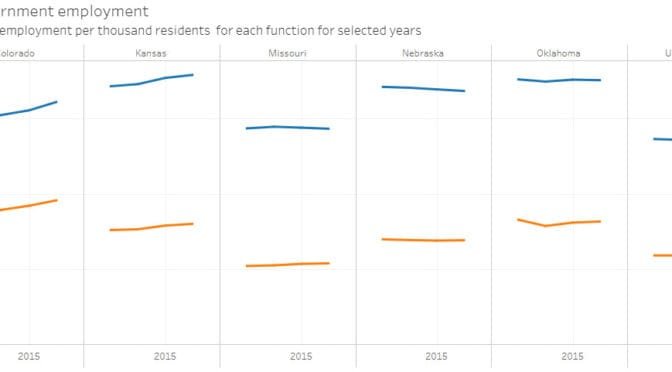
State government employees in Kansas
Kansas has more state government employees per resident than most states, and the trend is rising.
-
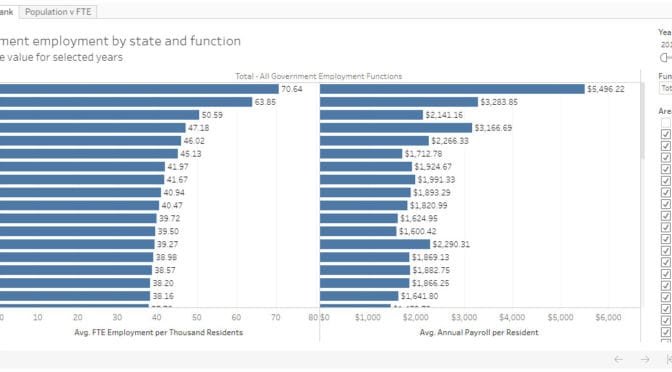
Local government employment in Kansas
Kansas has nearly the highest number of local government employees per resident, compared to other states.
-

WichitaLiberty.TV: Sedgwick County and Wichita issues
The end of a Sedgwick County Commission election, the *Wichita Eagle* editorializes on school spending and more taxes, and Wichita Mayor Jeff Longwell seems misinformed on the Wichita economy.
-
Sedgwick County jobs, first quarter 2018
For the first quarter of 2018, the number of jobs in Sedgwick County grew, but slower than the nation.