Tag: Education
-
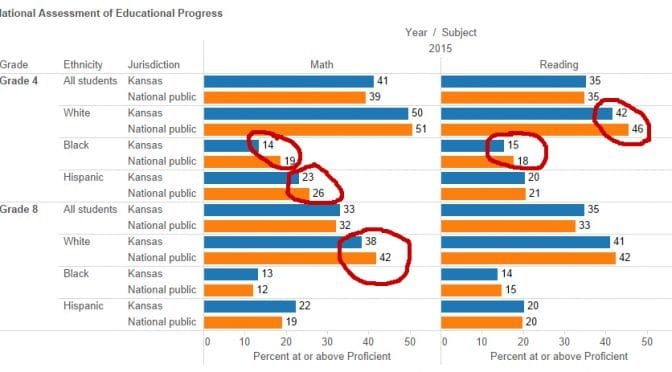
Kansas public education factbook
In debates over school funding and performance in Kansas, facts are often in short supply. Here is a compilation.
-
Kansas continues to snub school choice reform that helps the most vulnerable schoolchildren
Charter schools benefit minority and poor children, yet Kansas does not leverage their benefits, despite having a pressing need to boost the prospects of these children.
-
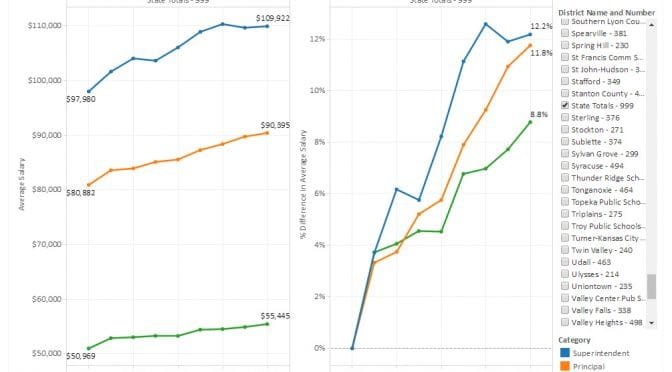
Kansas school salaries
Kansas school salaries for superintendents, principals, and teachers presented in an interactive visualization for each district, updated for 2016 data.
-
Kansas support for higher education
How does Kansas state support for higher education compare to other states?
-
At Pachyderm: Kansas Legislature education chairs to speak
This week the Wichita Pachyderm Club features the chairs of the Kansas Legislature’s two education committees.
-
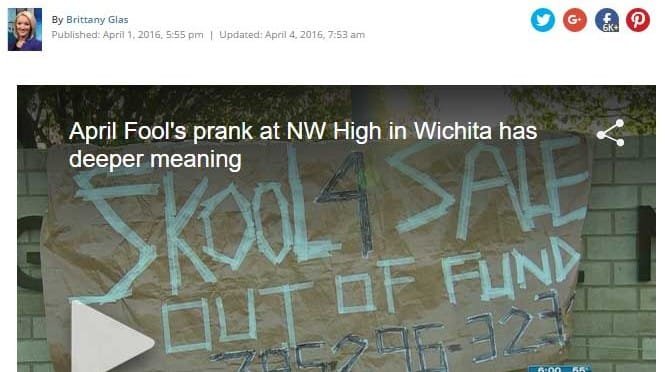
Northwest High prank, some underlying facts
Instead of pranking, Wichita public school students and their leaders might consider a few facts.
-

WichitaLiberty.TV: Markets or government, legislative malpractice, and education reform
Do corporations prefer markets or big government? Legislative malpractice in Kansas. Education reform, or lack thereof.
-
WichitaLiberty.TV: Bob’s shaking his head, Wichita water woes, and the harm of teachers unions
There are a few things that make Bob wonder. Then, a troubling episode for Wichita government and news media. Finally, the harm of teachers unions.
-

Kansas teachers union objects. Strenuously.
Here are a few items from today’s missive from Kansas National Education Association, the teachers union, along with commentary.
-

Kansas and Colorado, compared
News that a Wichita-based company is moving to Colorado sparked a round of Kansas-bashing, most not based on facts.
-

Math quiz on Kansas spending
The average Kansan is misinformed regarding Kansas school spending, and Kansas news media are to blame, writes Paul Waggoner of Hutchinson
-
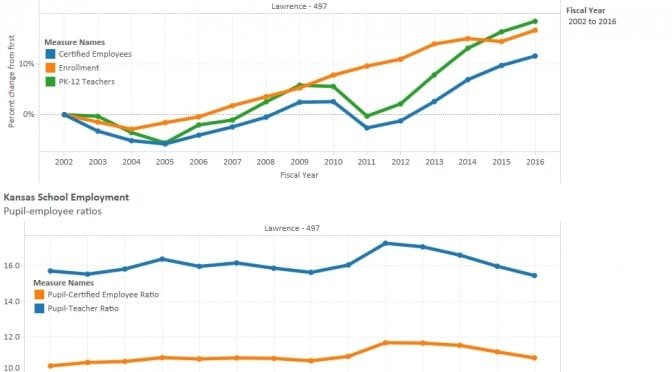
Lawrence school funding and employment
A Kansas school board president complains about funding, but the district has been able to grow employment faster than enrollment.