Tag: Featured
-

Sin-tax or vice-tax?
As Kansas considers raising additional revenue by raising the tax on tobacco and alcohol, let’s declare the end to governmental labeling of vice as sin, and people as sinners.
-

A Kansas calamity, at $15,399 per pupil
If things are so bad in Kansas schools at this level of spending, will any amount of spending satisfy school districts?
-

WichitaLiberty.TV: Wichita Eagle, Kansas Democrats, Kris Kobach on voting, and the minimum wage
Wichita Eagle labels hold a clue to the newspaper’s attitude, Kansas Democratic Party income tax reckoning, straight-ticket voting could leave some issues unvoted, and how a minimum wage hike would harm the most vulnerable workers.
-

For Kansas schools, a share of your income is the standard
If Kansas personal income rises but the school spending establishment doesn’t get its cut, something is wrong, they say.
-

Effect of federal grants on future local taxes
Do federal grants cause state and/or local tax increases in the future after the government grant ends?
-
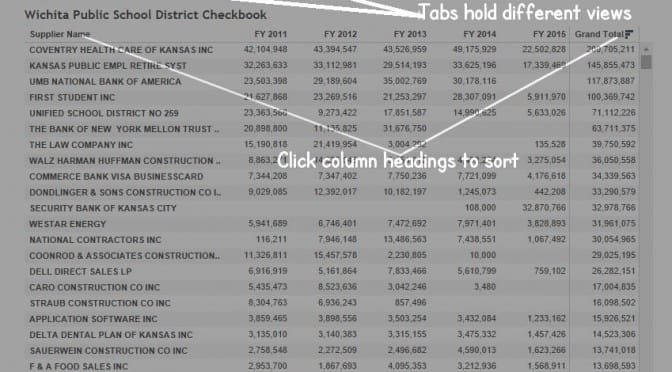
Wichita school district checkbook updated
An interactive table of checkbook spending by the Wichita public school district.
-

Wichita Eagle labels hold a clue
How Wichita Eagle news stories label outside organizations is a window into the ideology of the paper’s newsroom.
-

Kansas Democratic Party income tax reckoning
A story told to generate sympathy for working mothers at the expense of Kansas Governor Sam Brownback is based on arithmetic that is not plausible.
-

In Kansas, straight-ticket voting could leave some issues unvoted
There are several issues involved with straight-party voting. Kansas shouldn’t adopt this practice. But on the other hand, why not?
-

Wichita schools seek to rebrand
While poormouthing and suing taxpayers for more money, the Wichita school district wants to spend on a rebranding and marketing campaign.
-

In Kansas, PEAK has a leak
A Kansas economic development incentive program is pitched as being self-funded, but is probably a drain on the state treasure nonetheless.
-
Wichita city hall falls short in taxpayer protection
An incentives agreement the Wichita city council passed on first reading is missing several items that city policy requires. How the council and city staff handle the second reading of this ordinance will let us know for whose interests city hall works: citizens, or cronies.