Tag: Featured
-
Wichita Mayor Carl Brewer is concerned about misinformation
Wichita Mayor Carl Brewer is concerned about misinformation being spread regarding the proposed Wichita sales tax.
-

‘Yes Wichita’ co-chairs serve up contradicting plans for sales tax revenue
At two forums on the proposed Wichita sales tax, leaders of the “Yes Wichita” group provided contradicting visions for plans for economic development spending, and for its oversight.
-
Another Wichita sales tax forum
On Wednesday October 29 KCTU Television held a televised debate on the issue of the proposed one cent per dollar Wichita sales tax.
-
Wichita sales tax forum
The League of Women Voters — Wichita Metro held a lunchtime forum on the issue of the proposed one cent per dollar Wichita sales tax.
-

Wichita wants to expand water project, but abandons its website
As the City of Wichita recommends voters spend $250 million on the expansion of a water project, the project’s accompanying website was abandoned, and has now disappeared.
-
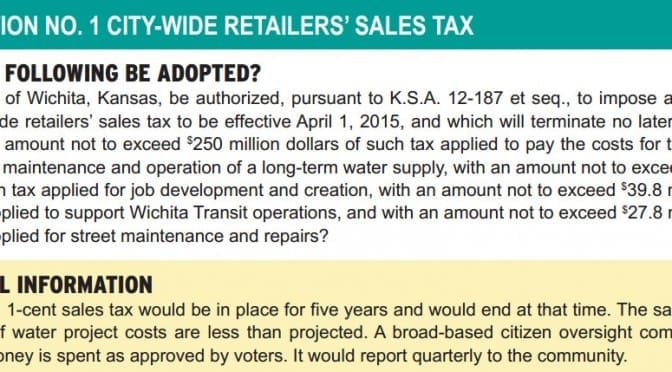
Examining claims in favor of the proposed Wichita sales tax
The “Yes Wichita” group has made a series of statements regarding plans for a new water supply. It’s important that Wichita voters be aware of the complete facts and context of these claims so that they make an informed decision on how to vote.
-

Wichita sends educational mailer to non-Wichitans, using Wichita taxes
Why is the City of Wichita spending taxpayer money mailing to voters who don’t live in the city and can’t vote on the issue?
-
Wichita sales tax hike harms low income families most severely
Analysis of household expenditure data shows that a proposed sales tax in Wichita affects low income families in greatest proportion, confirming the regressive nature of sales taxes.
-
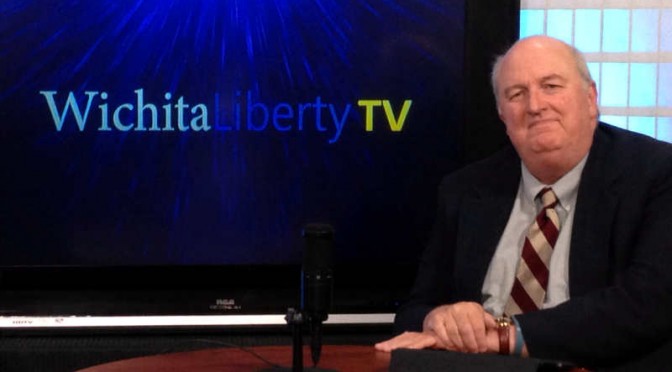
WichitaLiberty.TV: The proposed one cent per dollar Wichita sales tax
In this episode of WichitaLiberty.TV: We’ll talk about the proposed Wichita sales tax, including who pays it, and who gets special exemptions from paying it. Then, can we believe the promises the city makes about accountability and transparency? Finally, has the chosen solution for a future water supply proven itself as viable, and why are…
-

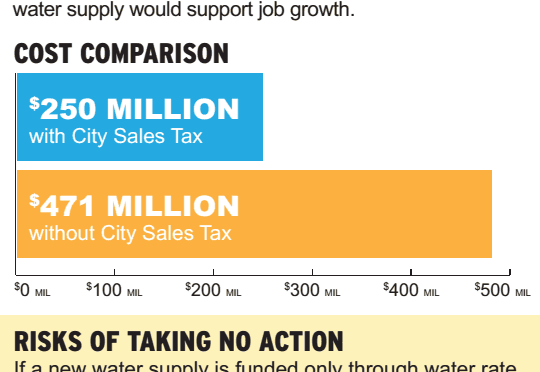
By threatening an unwise alternative, Wichita campaigns for the sales tax
To pay for a new water supply, Wichita gives voters two choices and portrays one as exceptionally unwise. In creating this either-or fallacy, the city is effectively campaigning for the sales tax.
-

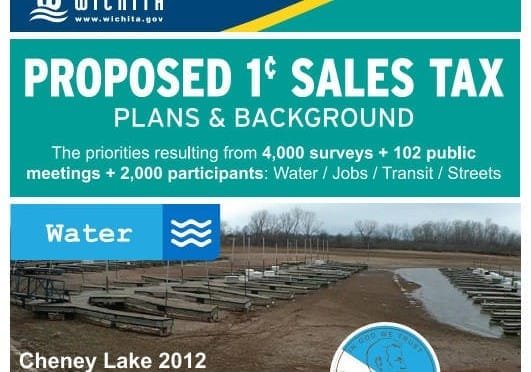
Should Wichita expand a water system that is still in commissioning stage?
In this script from the next episode of WichitaLiberty.TV, I report my concerns about rushing a decision to expand a water production system that has not yet proven itself.
-

For Wichita Chamber of Commerce chair, it’s sales tax for you, but not for me
A Wichita company CEO applied for a sales tax exemption. Now as chair of the Wichita Metro Chamber of Commerce, he wants you to pay more sales tax, even on the food you buy in grocery stores.