Tag: Featured
-

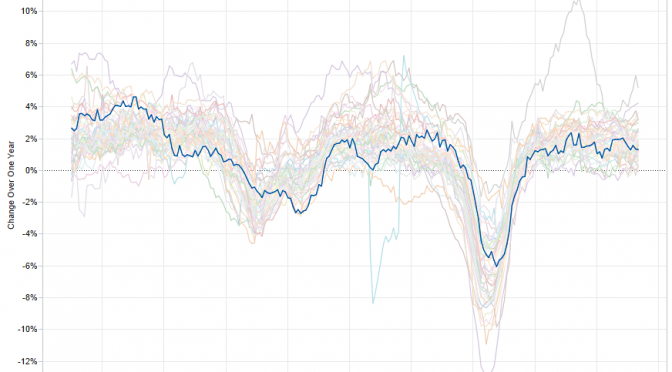
Wichita property taxes rise again
The City of Wichita is fond of saying that it hasn’t raised its mill levy in many years. But the mill levy has risen in recent years.
-

Recommended: Kansas Meadowlark
Kansas Meadowlark is the best site for aggregation of Kansas-centric news and opinion.
-
Job growth in the states and Kansas
Let’s ask critics of current Kansas economic policy if they’re satisfied with the Kansas of recent decades.
-

Quasi-lobbyist runs as earmarker in Kansas GOP primary
Washington Examiner writer Tim Carney notices the curious stance of a Republican candidate in the Kansas fourth district primary: He likes earmarks
-
WichitaLiberty.TV: Water, waste, signs, gaps, economic development, jobs, cronyism, and water again.
A look at a variety of topics, including an upcoming educational event concerning water in Wichita, more wasteful spending by the city, yard signs during election season, problems with economic development and cronyism in Wichita, and water again.
-

Fireworks!
In honor of our nation’s birthday, a slideshow of photographs of fireworks that I have taken.
-

Third annual Kansas Freedom Index released
The third annual Kansas Freedom Index takes a broad look at voting records and establishes how supportive state legislators are regarding economic freedom, student-focused education, limited government, and individual liberty.
-

Examining Wichita’s water future
On Thursday 17 July, come hear from the City of Wichita and others on the scope of the problems, possible solutions, and the perspectives of several experts in the debate over Wichita’s water future.
-

WichitaLiberty.TV: Vampires on the prowl in Wichita and the city council’s treatment of citizens.
The City of Wichita urges citizens to take steps to stop “vampire” power waste. But before hectoring people to introduce inconvenience to their lives in order to save small amounts of electricity, the city should tackle the real monsters of its own creation. Then proceedings of a recent Wichita City Council meeting are instructive of…
-
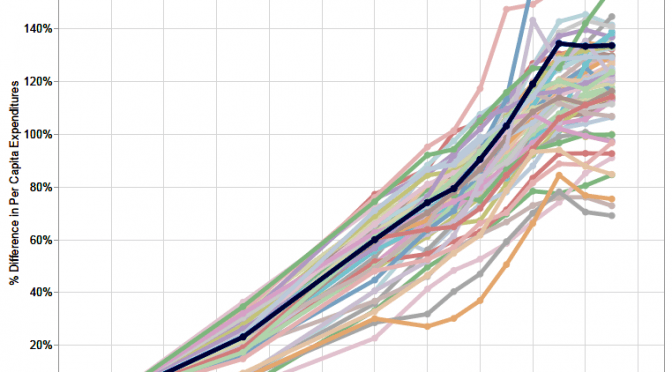
Kansas expenditures, compared to others
Spending by Kansas state and local governments has grown faster than in most other states.
-
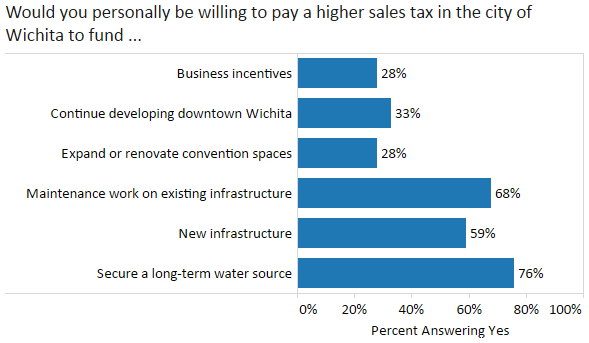
To fund government, Wichitans prefer alternatives to raising taxes
Wichita voters told pollsters they prefer adjusting spending, becoming more efficient, using public-private partnerships, and privatization to raising taxes.
-

Wichita performs well in local government job creation
The Wichita metropolitan area compares well creating jobs in local government, but trails in private sector jobs.