Tag: Featured

  • Kansas sales tax reform: Revenue booster?

    Kansas sales tax reform: Revenue booster?

    Kansas has a problem with sales tax exemptions, but the potential revenue boost from reform is not as great as commonly mentioned, unless Kansas wants to place its manufacturers at severe disadvantage.

    While the Wichita Eagle editorial board is correct to argue for eliminating sales tax exemptions, the amount of potential revenue is far less than presented, if we want to keep Kansas manufacturers competitive. Here’s what the Eagle editorial held:

    As a result, the number of sales-tax exemptions keeps growing — from 30 in 1985 to more than 100 today. And with each added exemption, the state is losing out on more revenue — $5.9 billion this fiscal year, according to the Kansas Department of Revenue. That’s money the state could be using to cover its budget shortfalls, increase funding to public schools or further reduce its income-tax rates.” (Reduce state sales tax exemptions, August 27, 2014)

    First, it’s good that the editorial board mentioned — as one possibility — the right thing to do if sales tax exemptions are eliminated, which is to reduce other taxes. Second, the state is not “losing out on more revenue” by granting sales tax exemptions. The state is simply letting people conduct certain transactions without being taxed, thereby letting them keep more of their own money. It’s true that the exemptions are granted in a way that is not equitable and does not promote economic growth, but that’s another issue.

    The big problem with the editorial is the amount of money mentioned as up for grabs, which is $5.9 billion. That is a lot of money. It’s almost as much as Kansas annual general fund spending. It’s worthwhile to look in detail at the nature of Kansas sales tax exemptions to understand their nature.

    In 2010 Kansas Legislative Division of Post Audit looked at the topic of sales tax exemptions and issued a report titled Kansas Tax Revenues, Part II: Reviewing Sales Tax Exemptions. The data in this report is from 2009, so it’s a few years out of date. But the principles and relative amounts remain the same. At the time of this report, advocates of eliminating sales tax exemptions in Kansas pointed, as they do now, to the great amount of revenue that could be raised if Kansas eliminated these exemptions, estimated at some $4.2 billion per year for 2009. Analysis of the nature of the exemptions and the amounts of money involved, however, leads us to realize that the additional tax revenue that could be raised is much less than spending advocates claim, unless Kansas was to adopt a severely uncompetitive, and in some cases, unproductive tax policy.

    Tax exemption policy is an important economic policy matter. In its background discussion, the Post Audit report noted “the U.S. Supreme Court’s opinion that tax exemptions and tax deductibility are a form of subsidy that is administered through the tax system. A tax exemption has much the same effect as a cash grant to the organization of the amount of tax it would have to pay on its income.”

    Sometimes these sales tax exemptions are issued to specific organizations. Others are issued to organizations that fall within certain categories. In this case, the exemption is like an entitlement, granted to any organization that falls within the scope of definition of the exemption. Some exemptions are for categories of business transactions that shouldn’t be taxed.

    It’s this last category that is important to recognize, because of the large amount of economic activity that falls within its scope. An example is exemption 79-3606 (m), described as “Ingredient/Component parts: Of items manufactured or produced for sale at retail.” The audit report estimates that for 2009, this exemption cost the state $2,248.1 million in lost sales tax revenue.

    But this exemption isn’t really an “exemption,” at least if the sales tax is a retail sales tax designed to be levied as the final tax on consumption. That’s because these goods aren’t being sold at retail. They’re sold to manufacturers who use them as inputs to products that, when finished, will be sold at retail. Most states don’t tax this type of sales. If Kansas decided to tax these transactions, it would place our state’s manufacturers at a severe disadvantage compared to almost all other states.

    There are two other exemptions that fall in this category of inputs to to production processes, totaling an estimated $461 million in lost revenue.

    Another big-dollar exemption is “items already taxed” such as motor fuel. This is an estimated $232.5 loss in revenue.

    Two other categories of exemptions are purchases made by government, or purchases made by contractors on behalf of government. Together these account for an estimated $449.9 million in lost sales tax revenue. If these two exemptions were eliminated, government would be taxing itself and no net revenue is gained.

    All told, these six exemptions account for $3,391.5 million of the total $4,234.2 million in exemptions for 2009. That’s about 80 percent.

    So $4.2 billion has shrunk to $842.7 million. That’s still a lot of money, but not near as much as spending advocates would like to have Kansans believe is lying in wait just for the taking.

  • ‘Transforming Wichita’ a reminder of the value of government promises

    ‘Transforming Wichita’ a reminder of the value of government promises

    When Wichita voters weigh the plausibility of the city’s plans for spending proposed new sales tax revenue, they should remember this is not the first time the city has promised results and accountability.

    Do you remember Transforming Wichita? According to the city, “Transforming Wichita is the journey by which we are fundamentally changing the way we measure, report and perform the work of delivering services to the citizens of Wichita.”

    In more detail, the city website proclaimed: “TW is the journey by which we will be fundamentally changing the way we deliver services to the citizens of Wichita. Our vision is for Wichita to be a premiere Midwestern city where people want to visit, live and play and for the city government to be a model of world class city governance where citizens receive the best possible value for their tax dollars and have confidence in their city government.”

    At the end of this article I present the complete page from the city’s website as captured on November 10, 2007. That’s just seven years ago. There are officeholders (Wichita Mayor Carl Brewer, City Council member Jeff Longwell, City Council member Lavonta Williams) and many bureaucrats still in office from that year. It’s not ancient history.

    Some of the most frequently-mentioned concepts in this document are:

    • performance
    • accountability
    • trust
    • confidence
    • measure and report

    Wichita spending data.
    Wichita spending data.
    The document mentions “supported by modernized information systems that facilitate collaboration with our partners.” That promise was made seven years ago. Today, do you know what you get when you ask the City of Wichita for spending records? The city can supply data of only limited utility. When I asked for spending records, what was supplied to me was data in pdf form, and as images, not text. It would be difficult — beyond the capability of most citizens — to translate the data to useful format. Even if someone translated the reports to computer-readable format, I don’t think the data would be very useful. This is a serious defect in the city’s transparency efforts.

    How does Wichita compare to other jurisdictions in this regard? Many governmental agencies post their checkbooks on their websites, having mastered this aspect of accountability and trust years ago. Not so the City of Wichita.

    Speaking of websites: The new and “improved” wichita.gov website is actually less useful than the city’s website in 2007. For more on this see A transparency agenda for Wichita.

    Regarding performance: One of the most important functions city leaders say they perform is economic development, specifically the creation of jobs. Last year when the Wichita Eagle asked for job creation figures, it reported this:

    “It will take us some time to pull together all the agenda reports on the five-year reviews going back to 2003. That same research will also reveal any abatements that were ‘retooled’ as a result of the five-year reviews,” city urban development director Allen Bell said.

    One might have thought that the city was keeping records on the number of jobs created on at least an annual basis for management purposes, and would have these figures ready for immediate review. If the city had these figures available, it would be evidence of trustworthiness, performance, accountability, and measuring and reporting. But the city isn’t doing this.

    Regarding values for dollars spent: During the past decade Wichita spent $247 million on the Aquifer Storage and Recovery Program, or ASR. As that project was contemplated, Wichita was told there was sufficient water for the next 50 years. We should ask: What value did we receive for those dollars?

    Speaking of accountability: Much of the money used to pay for the ASR project was borrowed in the form of long-term debt. Now we are told that long-term borrowing to pay for a new water supply would be bad fiscal management. So was it was prudent and advisable to borrow over $200 million for water projects during the last decade? Who do we hold accountable for that decision, if what city leaders now say is correct?

    Here’s a page from the city’s website as captured on November 10, 2007:

    Transforming Wichita

    Transforming Wichita is the journey by which we are fundamentally changing the way we measure, report and perform the work of delivering services to the citizens of Wichita. Our Vision:

    • For Wichita to be a premiere Midwestern city where people want to visit, live and play (as envisioned in Visioneering Wichita).
    • For Wichita City government to be a model of world class city governance — where citizens are getting the best possible value for their dollars and the City has the public’s confidence and trust. For this vision to be attained, we have to adapt to change!

    twWhile we are doing a lot of things right, we can’t be complacent, resting on our laurels from past successes. The paradox is that we must retain faith that the future is bright, while being willing to face challenges of our current situation. We must be willing to challenge every aspect of how we’re doing things today. We must position ourselves for the future.

    We will do this by transforming City government into a high performance organization that:

    • Focuses on results
    • Understands what results matter most to their customers
    • Makes performance matter
    • Moves decision-making down and out to the front-line, closest to customers; and
    • Fosters an environment of excellence, inclusiveness, accountability, learning and innovation.

    Through Transformation Wichita:

    • We deliver outstanding results that matter to our customers and are trustworthy stewards of the funds with which citizens have entrusted us;
    • We utilize team work and the best business processes, supported by modernized information systems that facilitate collaboration with our partners;
    • We measure and report on our work, using a balanced scorecard that shows progress and results in how we carry out programs and activities, so that performance matters; and
    • We engage in work that produces results that matter for our customers; we will work with colleagues in an environment where learning enriches us and innovation expands our potential.

    More about TW

    TW is the journey by which we will be fundamentally changing the way we deliver services to the citizens of Wichita. Our vision is for Wichita to be a premiere Midwestern city where people want to visit, live and play and for the city government to be a model of world class city governance where citizens receive the best possible value for their tax dollars and have confidence in their city government.

    While the City is doing a lot of things right, we can’t be complacent. We must be willing to challenge every aspect of how we’re doing things today and position ourselves for the future.

    We will accomplish this by transforming City government into a high performance organization that:

    • Delivers outstanding results that matter to our customers and is a trustworthy steward of the funds with which citizens have entrusted us;
    • We utilize team work and the best business processes, supported by modernized information systems that facilitate collaboration with our partners;
    • We measure and report on our work, using processes that show progress and results in how we carry out programs and activities; and
    • We engage in work that produces results that matter for our customers.
  • Wichita planning results in delay, waste

    Wichita planning results in delay, waste

    Wichita plans an ambitious road project that turns out to be too expensive, resulting in continued delays for Wichita drivers and purchases of land that may not be needed.

    A major road construction project in east Wichita is deferred after the design is too expensive, reports the Wichita Eagle. (East Kellogg interchange plan getting major reboot, August 30, 2014)

    It’s bad news that Wichita drivers will suffer through more years of delay as they travel through east Wichita. The value of the lost hours sitting in traffic? It’s impossible to say.

    But here’s something that will probably be easy to appraise: The waste of taxpayer dollars due to the actions of government planners. From the Eagle story:

    It’s unclear how the redesign would affect the ongoing lawsuit between the city of Wichita and 10 property owners whose land was taken by eminent domain for the project. The city also has acquired another 30 parcels in the area.

    A court-appointed panel of three appraisers awarded the owners of the 10 parcels a collective $19.6 million for their properties in November.

    The Wichita City Council approved the award, as required by the court, but the amount far exceeded an internal estimate in the $4 million to $5 million range.

    In December, the city sued the landowners to see if a court would reduce the valuations.

    Some of that land probably would not be needed if the interchange is redesigned.

    Did you catch that? The city spent nearly five times as much as original estimates to seize property through eminent domain, and also purchased other property. Buildings with remaining useful life have been razed. Now, we learn that this land may not be needed.

    As Wichita city hall asks citizens to trust the plans for the proceeds of a new sales tax, remember lessons like this.

  • Wichita arena sales tax not a model of success

    Wichita arena sales tax not a model of success

    Supporters of a new sales tax in Wichita use the Intrust Bank Arena as an example of successful application of a sales tax.

    As Wichita debates the desirability of a sales tax, a former sales tax is used as a model of success. Let’s take a look at a few of the issues.

    Ongoing vs. capital expenses

    A portion of the proposed sales tax will be used for operational expenses, and the demand for this spending will not end when the sales tax ends.

    The sales tax for the Intrust Bank Arena was used to build a capital asset and establish a small reserve fund. Spending on capital assets is characterized by a large expense in a short period of time as the asset is constructed. Then, the spending is over — sort of.

    For the proposed Wichita sales tax, 63 percent is scheduled for capital asset spending on an enhanced water supply. The remainder, 37 percent, is for operation of the bus transit system, street repair, and economic development. These three items are operational in nature, meaning they are ongoing expenses. It’s not likely that after five years the bus system will be self-sustaining, or that streets will no longer need repair, or that there will be no more clamoring for economic development.

    There is a large difference, then, between the arena sales tax and the proposed Wichita sales tax. While sales tax boosters say the tax will end in five years, the likelihood is that because much of it will have been paying for operational expenses, there will be great pressure to continue the tax and the spending it supports. That’s because the appetite for tax revenue by government and its cronies is insatiable. An example: As the arena sales tax was nearing its end, Sedgwick County Commissioner Tim Norton “wondered … whether a 1 percent sales tax could help the county raise revenue.” (“Norton floats idea of 1 percent county sales tax,” Wichita Eagle, April 4, 2007)

    Intrust Bank Arena economics

    Having promoted a false and incomplete picture of the economics of the Intrust Bank Arena, civic leaders now use it as a model of success.

    The building of a new arena in downtown Wichita was promoted as an economic driver. So far, that hasn’t happened. There have been spurts of development near the arena. But the arena is also surrounded by empty lots and empty retail space, and there have been months where no events took place at the arena.

    Regarding the accounting of the profits earned by the arena, we need to realize that civic leaders are not telling citizens the entire truth. If proper attention was given to the depreciation expense of Intrust Bank Arena, that would recognize and account for the sacrifices of the people of Sedgwick County and its visitors to pay for the arena. This would be a business-like way of managing government — something we’re promised. But that hasn’t happened.

    Civic leaders and arena boosters promote a revenue-sharing arrangement between the county and the arena operator, referring to this as profit or loss. But this arrangement is not an accurate and complete accounting, and it hides the true economics of the arena. An example of the incomplete editorializing comes from Rhonda Holman of the Wichita Eagle, who earlier this year wrote “Though great news for taxpayers, that oversize check for $255,678 presented to Sedgwick County last week reflected Intrust Bank Arena’s past, specifically the county’s share of 2013 profits.”

    There are at least two ways of looking at the finances of the arena. Most attention is given to the “profit” (or loss) earned by the arena for the county according to an operating and management agreement between the county and SMG, a company that operates the arena.

    This agreement specifies a revenue sharing mechanism between the county and SMG. For 2103, the accounting method used in this agreement produced a profit of $705,678, to be split (not equally) between SMG and the county. The county’s share, as Holman touted, was $255,678. (Presumably that’s after deducting the cost of producing an oversize check for television cameras.)

    The Operations of Intrust Bank ArenaWhile described as “profit” by many, this payment does not represent any sort of “profit” or “earnings” in the usual sense. In fact, the introductory letter that accompanies these calculations warns readers that these are “not intended to be a complete presentation of INTRUST Bank Arena’s financial position and results of operations and are not intended to be a presentation in conformity with accounting principles generally accepted in the United States of America.”

    That bears repeating: This is not a reckoning of profit and loss in any recognized sense. It is simply an agreement between Sedgwick County and SMG as to how SMG is to be paid, and how the county participates.

    A much better reckoning of the economics of the Intrust Bank Arena can be found in the 2013 Comprehensive Annual Financial Report for Sedgwick County. The CAFR, as described by the county, “… is a review of what occurred financially at Sedgwick County in 2013. In that respect, it is a report card of our ability to manage our financial resources.” Regarding the arena, the CAFR states:

    The Arena Fund represents the activity of the INTRUST Bank Arena that opened on January 9, 2010. The facility is operated by a private company; the county incurs expenses only for certain capital improvements or major repairs and depreciation, and receives as revenue only a share of profits earned by the operator, if any. The Arena had an operating loss of $4.7 million. The loss can be attributed to $5.3 million in depreciation expense.

    Financial statements in the same document show that $5,295,414 was charged for depreciation in 2013, bringing accumulated depreciation to a total of $21,190,280.

    Depreciation expense is not something that is paid out in cash. Sedgwick County didn’t write a check for $5,295,414 in depreciation expense. Instead, depreciation accounting provides a way to recognize the cost of long-lived assets over their lifespan. It provides a way to recognize opportunity costs, that is, what could be done with our resources if not spent on the arena.

    Any honest reckoning of the economic performance of Intrust Bank Arena must include depreciation expense. We see our governmental and civic leaders telling us that we must “run government like a business.” Without frank and realistic discussion of numbers like these and the economic facts they represent, we make decisions based on incomplete and false information.

    Effect on sales and jobs

    Taxes have an impact. Definitely.

    Boosters of the proposed Wichita sales tax say that since it is so small — “just one cent,” they say — its effect won’t be noticed. I wonder: If increasing prices by one percent has no effect, why don’t merchants raise their prices by one percent right now and pocket the profit?

    Taxes have an impact. The problem with assessing the impact is that the results of the tax are usually concentrated and easy to see — a new arena, water supply, repaved streets, more buses, etc. But the consequences of the tax are usually spread out over a large number of people and collected in small amounts. The costs are dispersed, and therefore more difficult to detect. But there has been an analysis performed of a situation parallel to the Intrust bank Arena tax.

    A paper titled “An Assessment of the Economic Impact of a Multipurpose Arena” by Ronald John Hy and R. Lawson Veasey, both of the University of Central Arkansas, (Public Administration & Management: An Interactive Journal 5, 2, 2000, pp. 86-98) looked at the effect of jobs and economic activity during the construction of the Alltel Arena in Pulaski County, Arkansas. This arena cost $50 million. It was funded in part by a one percent increase in the county sales tax for one year (1998). The sales tax generated $20 million.

    In the net, considering both jobs lost and jobs gained due to sales tax and construction effects, workers in the wholesale and retail trades lost 60 jobs, and service workers lost 52 jobs. There was a net increase of 198 jobs in construction.

    The fact that jobs were lost in retail should not be a surprise. When a sales tax makes nearly everything sold at retail more expensive, less is demanded. It may be difficult to estimate the magnitude of the change in demand, but it is certain that it does change.

    The population of Pulaski County in 2000 was 361,474, while Sedgwick County’s population at the same time was 452,869, so Sedgwick County is somewhat larger. The sales tax for the arena lasted 2.5 times as long, and our arena was about three times as expensive. How these factors affected the number of jobs is unknown, but it’s likely that the number of jobs lost in Sedgwick County in retail and services was larger that what Pulaski County experienced.

  • When Wichita officials promise to look out for your interests, remember last summer

    When Wichita officials promise to look out for your interests, remember last summer

    When the City of Wichita tells citizens that it will thoroughly investigate and vet potential economic development projects and partners, remember what the city did just last summer.

    Citizens of Wichita are rightly concerned whether our elected officials and bureaucrats are looking out for their interests, or only for the interests and welfare of a small group of city hall insiders — the cronies.

    Now, selling a new sales tax, part of which would pay for economic development, city officials say they will really be careful. Officials have made these promises before, but just last summer an incident show just how little the city cares about citizens. The video below explains, or click here to view in high definition on YouTube. For an article on this topic, see Wichita performs a reference check, sort of.

  • State and local tax burdens presented

    State and local tax burdens presented

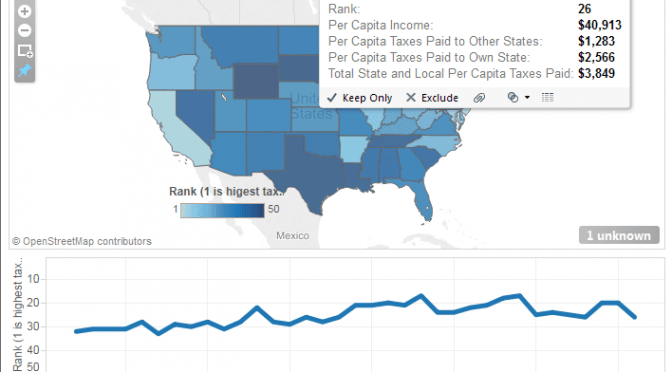
    For two decades the Tax Foundation has estimated the combined state and local tax burden for all the states. I’ve created an interactive visualization that lets you compare states and see trends in rank over time.

    In its publication, the Tax Foundation explains:

    For nearly two decades, the Tax Foundation has published an estimate of the combined state and local tax burden shouldered by the residents of each of the fifty states, regardless of the jurisdictions to which those taxes are paid. We argue that it is important to note that a taxpayer’s true tax burden must include the substantial taxes they pay directly or indirectly to out-of-state governments.

    Tax Foundatation State and Local Tax Burden, August 2014When organizations analyzing federal tax burdens, such as the Congressional Budget Office or the Urban-Brookings Tax Policy Center, measure tax burdens by income group, they go beyond measuring the legal incidence of a tax (who writes the check to the government) and account for the fact that taxes legally imposed on a given person in one income group (such as employers via the payroll tax) can be shifted to a different person in another income group (like employees). Similarly, our state and local tax burden estimates account for the shifting of taxes from one group to another under a different variable by which household are organized: state of residence rather than income level. …

    In this annual study, our goal is to move the focus from the tax collector (how much revenue is collected) to the taxpayer (how much income is foregone). We aim to find what percentage of state income residents are paying in state and local taxes and whether those taxes are paid to their state of residence or to others. …

    When answering the question of which state’s residents pay the most in state and local taxes, it should be clear that such tax burden measures are not measures of the size of government in a state, nor are they technically measures of the complete burden of taxation faced by a given state’s residents.

    The most recent version of the report is located at Annual State-Local Tax Burden Ranking FY 2011.

    To use the visualization, hover over any state from the map. Click here to open the visualization in a new window. The most recent data is for fiscal year 2011. Data from Tax Foundation; visualization created using Tableau Public.

  • Employment in the states

    Employment in the states

    There are dueling claims and controversy over employment figures in Kansas and our state’s performance relative to others. I present the actual data in tables and interactive visualizations that you can use to make up your own mind.

    (Let’s keep in mind that jobs are not necessarily the best measure of economic growth and prosperity. Russell Roberts relates an anecdote: “The story goes that Milton Friedman was once taken to see a massive government project somewhere in Asia. Thousands of workers using shovels were building a canal. Friedman was puzzled. Why weren’t there any excavators or any mechanized earth-moving equipment? A government official explained that using shovels created more jobs. Friedman’s response: ‘Then why not use spoons instead of shovels?’”)

    It’s important to note there are two series of employment data provided by the U.S. Bureau of Labor Statistics, which is part of the U.S. Department of Labor. The two series don’t measure exactly the same thing. A document from BLS titled Employment from the BLS household and payroll surveys: summary of recent trends explains in brief: “The Bureau of Labor Statistics (BLS) has two monthly surveys that measure employment levels and trends: the Current Population Survey (CPS), also known as the household survey, and the Current Employment Statistics (CES) survey, also known as the payroll or establishment survey. … These estimates differ because the surveys have distinct definitions of employment and distinct survey and estimation methods.”

    Employment in the States, Year-Over-Year Change, Private Industries, Kansas Highlighted
    Employment in the States, Year-Over-Year Change, Private Industries, Kansas Highlighted
    Importantly, since the CES gets its data from employers, it reports on jobs located in the state where the company is located, not where workers live. Similarly, the CPS reports data based on where people live, not where they work. For areas that straddle state lines — like the Kansas City Metropolitan Area — this is an important factor.

    Another BLS document explains in detail the differences between the CPS and CES data. For example: CES: “Designed to measure employment, hours, and earnings with significant industrial and geographic detail” CPS: “Designed to measure employment and unemployment with significant demographic detail.”

    Another difference: CES: “Self-employed persons are excluded.” CPS: “Self-employed persons are included.” (See Understanding the employment measures from the CPS and CES survey.)

    Employment Levels, Year-Over-Year Change, Kansas Highlighted
    Employment Levels, Year-Over-Year Change, Kansas Highlighted
    I’ve gathered data from BLS and made it available in two interactive visualizations. One presents CPS data; the other holds CES data. You can compare states, select a range of dates, and choose seasonally-adjusted or not seasonally-adjusted data. I’ve create a set that allows you to easily choose Kansas and our nearby states, since that seems to be relevant to the current discussion. (I included Texas in this set, as we often compare ourselves to that state.) The visualizations show indexed data, meaning that we see the relative change in values from the first date shown. There is also year-over-year changes illustrated.

    Here is the visualization for Current Establishment Survey data, and here is visualization for Current Population Survey data.

  • Voice for Liberty Radio:  Kansas Secretary of Revenue Nick Jordan

    Voice for Liberty Radio: Kansas Secretary of Revenue Nick Jordan

    Voice for Liberty Radio 150x150In this episode of Voice for Liberty Radio: Nick Jordan is Secretary of Revenue for the State of Kansas. He spoke to the Wichita Pachyderm Club on the topic “An Analysis of Governor Brownback’s Tax Policy” on August 22, 2014. In the shownotes for this episode you can find the link to the handout he distributed.

    Here’s Kansas Secretary of Revenue Nick Jordan at the Wichita Pachyderm Club on August 22, 2014.

    Shownotes

    Handout: Kansas Tax Policy: Key Points
    Kansas Department of Revenue
    Wichita Pachyderm Club

  • Kansas campaign material repository

    Kansas campaign material repository

    An accessible collection of campaign material will help hold candidates and campaigns accountable.

    I’ve started a collection of Kansas political campaign material such as mailers, palm cards, handouts, and door hangers. This collection could be valuable in holding candidates of all parties accountable for their words. Independent organizations may advocate for or against candidates and ballot measures, and these need to be held accountable, too.

    It can be difficult to gather campaign material. Some is mailed or distributed only to small geographic districts. Or, material is mailed only to voters with certain characteristics, such as party registration or voting consistency. Unless you live in a “blended” household (with voters of different political parties), you may never see many campaign mailers. While some campaigns may make their mailers or similar material available on their websites or Facebook pages, it’s not common that the negative mail pieces — the ones that often contain the type of distortions that need to be exposed — are publicized by campaigns. (That may say something about negative campaigning.)

    You may view the material here.

    There are several ways to contribute to the repository.

    On your computer. A useful and valuable extension for Internet Explorer, Firefox, and Chrome browsers is FireShot. It will save partial or entire web pages in a variety of formats, including pdf.

    Printed material. The traditional scanner still makes the best captures. But now many people have a document capture system in their pocket and carry it with them at all times. It’s their smartphones. For information about using smartphones to capture documents, see Your smartphone is your activism toolkit. It’s not difficult to create valuable captures if you have the right app on your smartphone.

    Signs, etc. Take a photograph. It’s useful to take a wide shot to show context, and then a close-up to see the detail.

    You may send me digital files at bob.weeks@gmail.com. Or, you can send me postal mail at 2451 Regency Lakes Ct., Wichita, KS 67226. I won’t be able to return material you send me unless you include return postage.

    Before capturing and distributing material that has your name and address (or other personal information) consider obliterating it with a marker or scissors.