Tag: Featured
-

Kansas base state aid is only a part of spending
Using base state aid per pupil as the only measure of school funding leads to an incomplete understanding of school spending in Kansas.
-

What incentives can Wichita offer?
Wichita government leaders complain that Wichita can’t compete in economic development with other cities and states because the budget for incentives is too small. But when making this argument, these officials don’t include all incentives that are available.
-
WichitaLiberty.TV: Issues surrounding the Wichita sales tax and airport
Who would be most harmed by the proposed Wichita sales tax? Also: A look at updated airport statistics, and what the city could do if it wants to pass the sales tax.
-
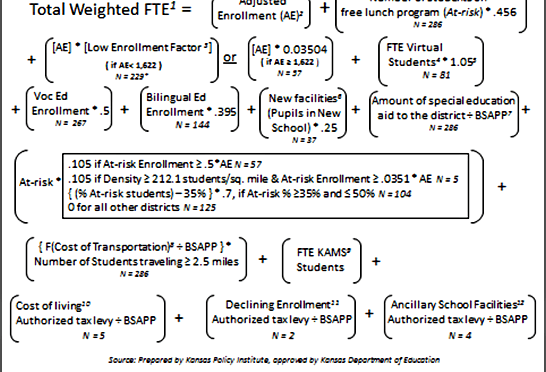
Kansas school finance formula explained
The updated version of the formula that will be used by the Kansas State Department of Education to determine student weighting in the coming school year is presented below.
-

Economic development in Wichita, one tale
In this excerpt from WichitaLiberty.TV: A look at a recent episode of economic development in Wichita, and what can we learn from that.
-
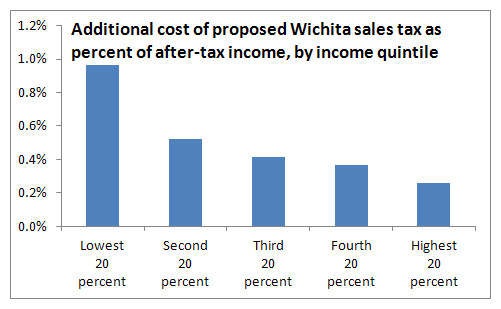
Wichita sales tax hike would hit low income families hardest
Analysis of household expenditure data shows that a proposed sales tax in Wichita affects low income families in greatest proportion, confirming the regressive nature of sales taxes.
-

Kansas budgeting “off the tops” is bad policy
Direct transfers of taxpayer money sent to a specific business or industry is always a tough sell to politicians, let alone the voting public. But, that is why some corporations pay lots of money to lobbyists, writes Steve Anderson for Kansas Policy Institute.
-
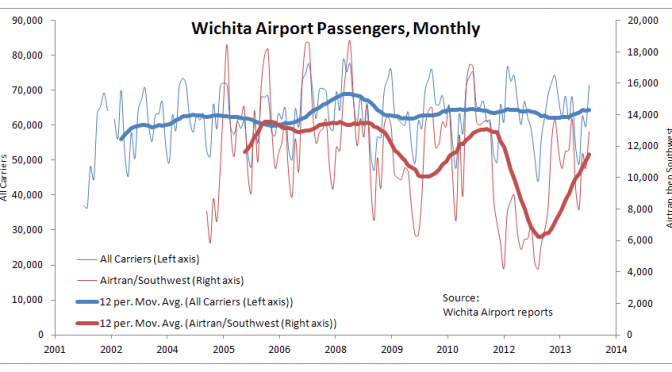
Wichita airport statistics updated
Why do Kansans pay taxes, including sales tax on food, to fund millions in subsidy to a company that is experiencing a sustained streak of record profits?
-

Susan Estes of AFP and the upcoming summt
On the Joseph Ashby Show, Susan Estes of Americans for Prosperity-Kansas appeared on August 7, 2014. Bob Weeks is the guest host. We discuss the the goals of AFP and the upcoming Defending the American Dream Summit in Dallas.