Tag: Featured
-

WichitaLiberty.TV: Judge Kevin Smith and foster care
Judge Kevin Smith explains some of the problems in the foster care system in Kansas, and what we can do to improve it.
-

Efficiencies in Sedgwick County government
A document that hasn’t been made public details savings achieved in Sedgwick County over a recent period of nearly three years.
-

On big contracts, Wichita has had problems
As Wichita prepares to award a large construction contract, let’s hope the city acts in an ethical manner this time.
-
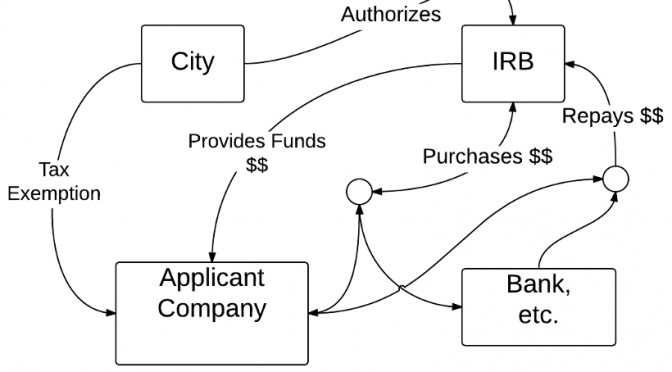
It’s not the bonds, it’s the taxes
A Wichita Eagle headline reads “Wichita aircraft supplier plans 45 new jobs with $7.5 million bond request,” but important information is buried and incomplete.
-
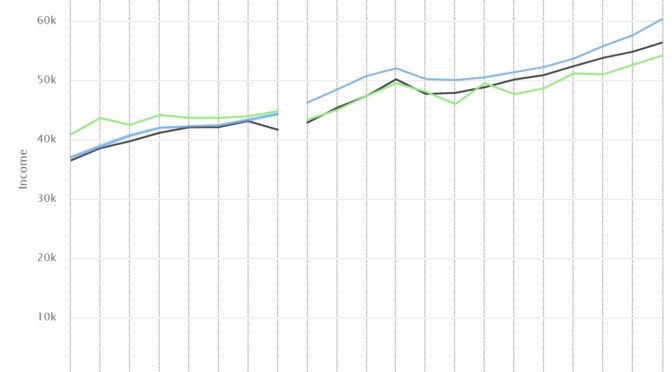
Sedgwick County income and poverty
Census data show Sedgwick County continues to fall behind the nation in two key measures.
-

WichitaLiberty.TV: Kansas Representative Leo Delperdang
Representative Leo Delperdang joins Bob Weeks to discuss the recent election and the upcoming session of the Kansas Legislature.
-
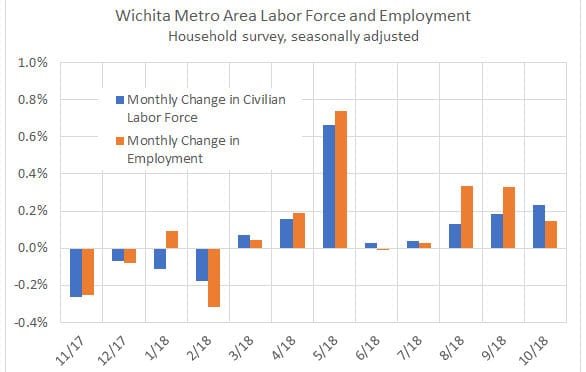
Wichita employment, October 2018
For the Wichita metropolitan area in October 2018, jobs are up, the labor force is up, and the unemployment rate is down, compared to the same month one year ago. Seasonal data shows a slowdown in the rate of job growth.
-

WichitaLiberty.TV: Economic development incentives
A look at some economic development incentive programs in Wichita and Kansas. Second in a series. Tax increment financing (TIF) is prominent in this episode.
-

Updated: Kansas tax receipts
Kansas tax receipts by category, presented in an interactive visualization.
-

Sedgwick County jobs, second quarter 2018
For the second quarter of 2018, the number of jobs in Sedgwick County grew slightly slower than the nation.
-

Kansas jobs, October 2018
For October 2018, an expanding labor force in Kansas, and a slight increase in jobs from September.
-

WichitaLiberty.TV: Economic development incentives
A look at some economic development incentive programs in Wichita and Kansas. First in a series.