Tag: Featured
-

Pete Meitzner for Sedgwick County?
In normal times, Republicans may be reluctant to vote for a Democrat for the Sedgwick County Commission. But these are not normal times, and a vote for Pete Meitzner sends a message that we just don’t care about our economy.
-

WichitaLiberty.TV: Richard Ranzau and Renee Duxler
Sedgwick County Commissioner Richard Ranzau explains the current problems with corruption in the county. Then, Renee Duxler tells us why she’s running for Sedgwick County Commission.
-

Kansas jobs, September 2018
For September 2018, more jobs in Kansas than last September, but fewer than in August.
-
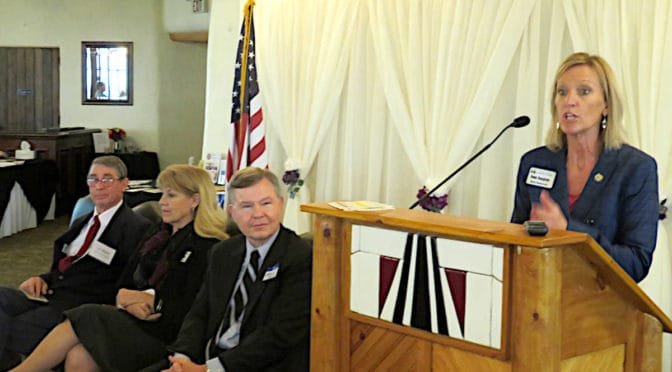
From Pachyderm: Kansas House candidates
From the Wichita Pachyderm Club: Republican candidates for the Kansas House of Representatives.
-
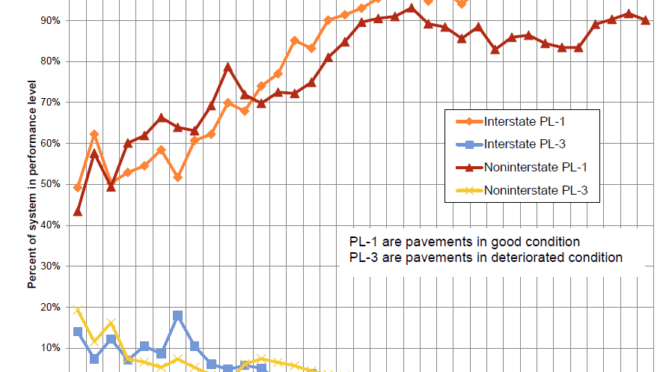
Kansas highway pavement conditions
What is the condition of Kansas highways?
-
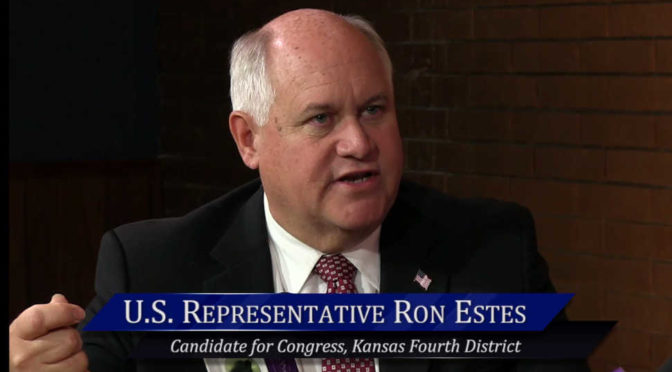
WichitaLiberty.TV: United States Representative Ron Estes
Republican candidate for Congress Representative Ron Estes explains why he should continue to be our representative in the United States House of Representatives.
-
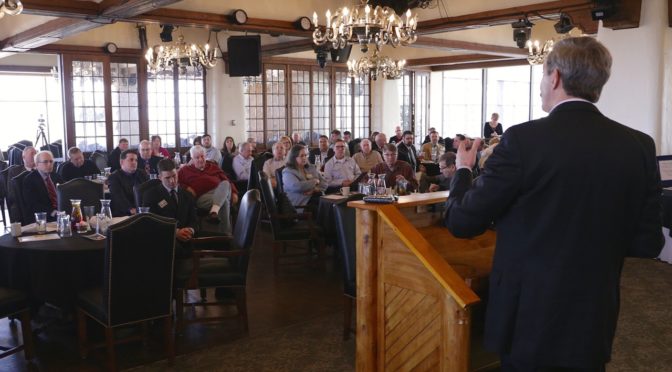
Political civility in our age of thuggery
From Karl Peterjohn, an account of why the Wichita Pachyderm Club is a valuable civic institution.
-
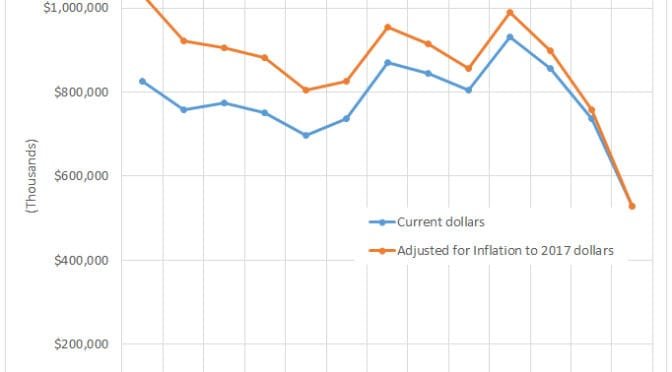
Kansas highway spending
A look at actual spending on Kansas highways, apart from transfers.
-

Kansas school spending, through 2018
Charts of Kansas school spending presented in different forms.
-

WichitaLiberty.TV: Candidate for Congress James Thompson
Democratic Party candidate for Congress James Thompson explains why he should be our next representative in the United States House of Representatives.
-

From Pachyderm: Economic development incentives
A look at some of the large economic development programs in Wichita and Kansas.
-

WichitaLiberty.TV: Author Lenore Skenazy, “America’s Worst Mom”
Author Lenore Skenazy talks about today’s children and the free-range kids movement.