Tag: Featured
-
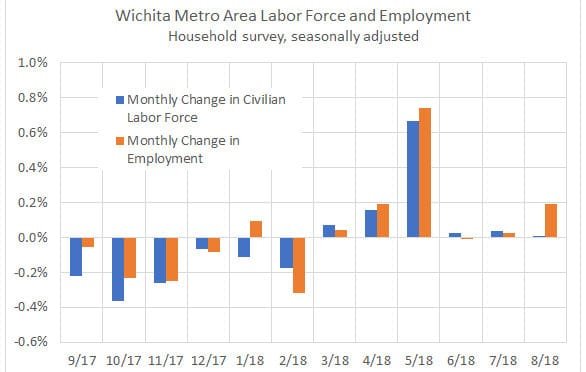
Wichita employment, August 2018
For the Wichita metropolitan area in August 2018, jobs are up, the unemployment rate is down, and the labor force is smaller, compared to the same month one year ago.
-
Education gap on Wichita City Council
Currently there is discussion in Wichita on whether higher education is valued by residents. Following, from April 2011, a look at the educational achievement of the Wichita City Council.
-
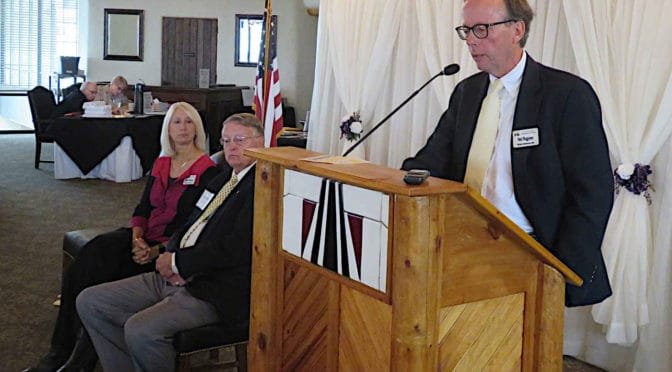
From Pachyderm: Kansas House candidates
From the Wichita Pachyderm Club: Republican Party Kansas House of Representatives candidates.
-

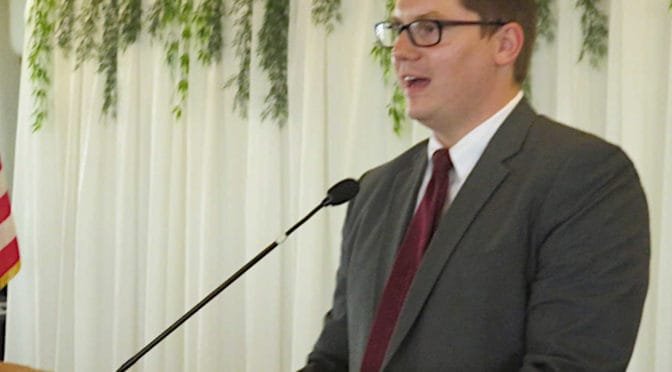
WichitaLiberty.TV: Kansas gubernatorial candidate Kris Kobach
Republican Party candidate for Kansas governor and current Secretary of State Kris Kobach joins Bob and Karl to explain why he should be our next governor.
-

Kansas agriculture and the economy
What is the importance of agriculture to the Kansas economy?
-

Kansas and Wichita jobs, August 2018
For August 2018, more jobs in Kansas, and a nearly unchanged labor force. Wichita jobs also rose.
-
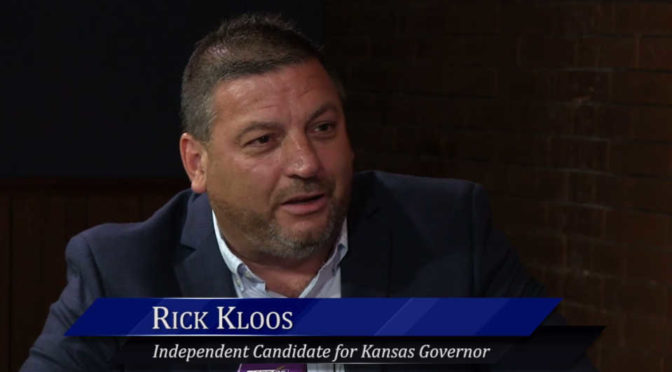
WichitaLiberty.TV: Kansas gubernatorial candidate Rick Kloos
Independent candidate for Kansas governor Rick Kloos joins Bob and Karl to explain why he should be our next governor.
-
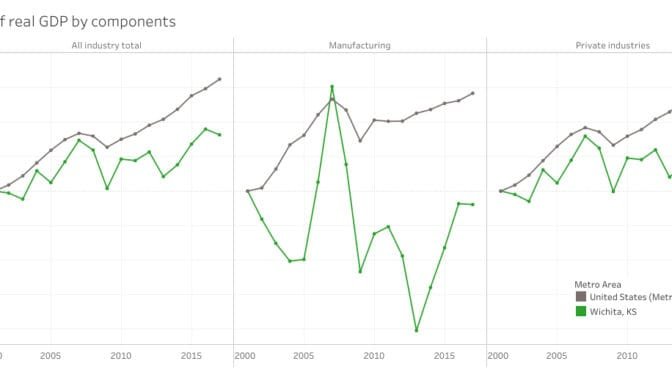
GDP by metropolitan area and component
An interactive visualization of gross domestic product by metropolitan area and industry.
-

Wichita economy shrinks, and a revision
The Wichita economy shrank in 2017, but revised statistics show growth in 2016.
-
From Pachyderm: Kansas Treasurer Jake LaTurner
From the Wichita Pachyderm Club: Kansas Treasurer Jake LaTurner. This was recorded on September 14, 2018.
-
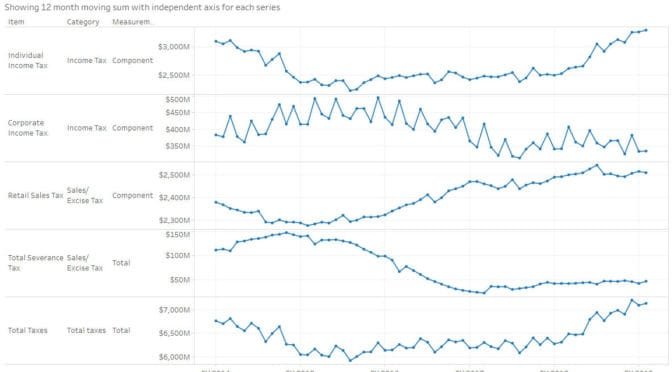
Kansas tax receipts
Kansas tax receipts by category, presented in an interactive visualization.
-
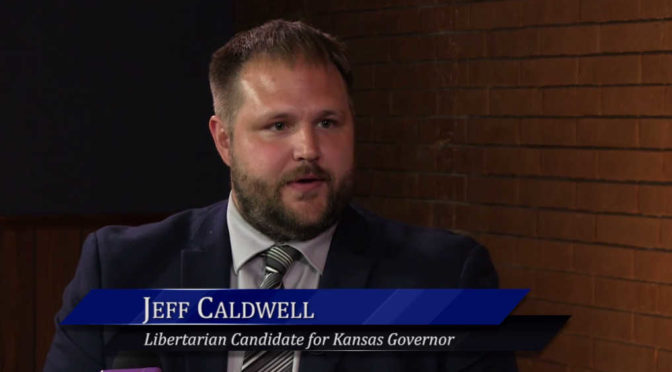
WichitaLiberty.TV: Kansas gubernatorial candidate Jeff Caldwell
Libertarian Party candidate for Kansas governor Jeff Caldwell joins Bob and Karl to explain why he should be our next governor.