Tag: Featured
-

Judge Melgren defends Constitutional protections
By Karl Peterjohn While it has become increasingly common for members of the U.S. Supreme Court to make news by public comments, particularly during their summer recess, Wichita Pachyderm Club members had the opportunity for Kansas federal district Judge Eric F. Melgren to quote from his judicial colleagues in a way of defending the Constitution’s…
-
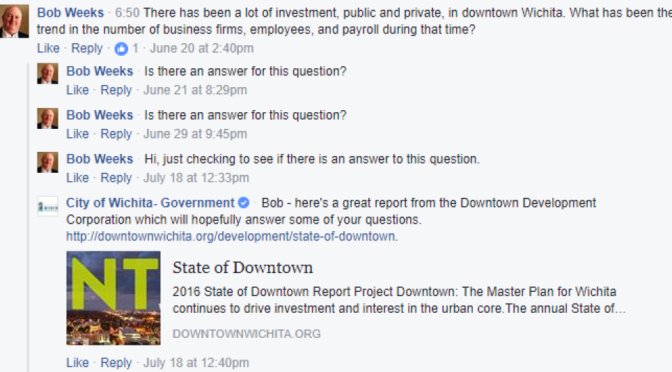
A Wichita social media town hall
A City of Wichita town hall meeting ends in less than nine minutes, with a question pending and unanswered.
-

Naftzger Park tax increment financing (TIF)
Background on tax increment financing (TIF) as applied to Naftzger Park in downtown Wichita.
-

Upcoming Naftzger Park legislative action
The redesign of Naftzger Park in downtown Wichita is not a done deal, at least not legally.
-

WichitaLiberty.TV: After the Kansas tax increases
Jonathan Williams, chief economist at American Legislative Exchange Council (ALEC), joins Bob Weeks and Karl Peterjohn to discuss what ALEC does, and then topics specific to Kansas.
-

Wichita MSA employment series
Charts of employment in the Wichita metro area, along with Kansas and the United States.
-
Wichita WaterWalk contract not followed, again
Wichita city hall failed to uphold the terms of a development agreement from five years ago, not monitoring contracts that protect the public interest.
-
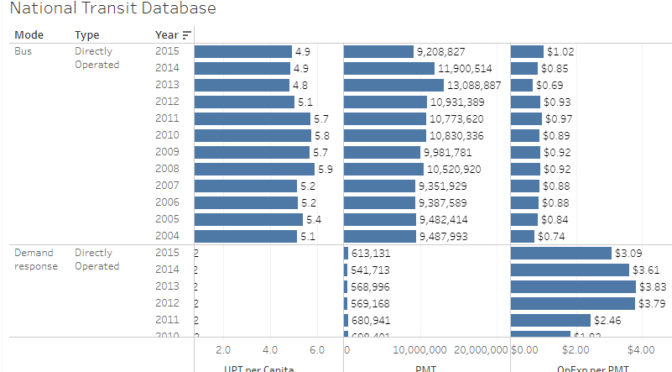
National Transit Database, an interactive visualization
An interactive visualization of data over time from the National Transit Database.
-
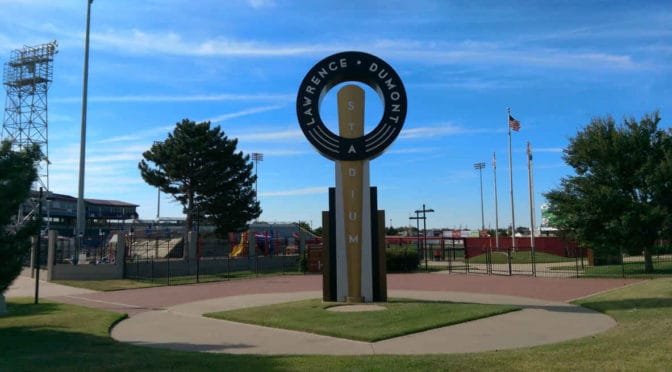
In Wichita, new stadium to be considered
The City of Wichita plans subsidized development of a sports facility as an economic driver.
-

WichitaLiberty.TV: Being safe online
In this episode of WichitaLiberty.TV: Dave Cunningham of Flint Hills Group joins Bob Weeks and Karl Peterjohn to discuss online threats and how to remain safe.
-

Intrust Bank Arena loss for 2016 is $4,293,901
As in years past, a truthful accounting of the finances of Intrust Bank Arena in downtown Wichita shows a large loss.
-
Happy Fiscal New Year, Kansas (not)
A Kansas public policy group celebrates tax increases. But it isn’t enough, and more reform is required.