Tag: Featured
-
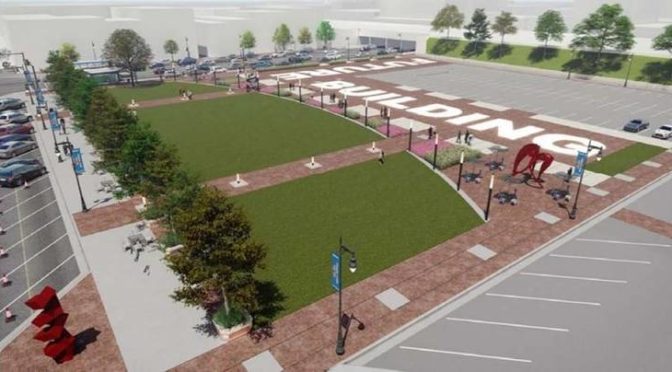
Naftzger Park public hearing to be considered
The Wichita City Council may set August 15, 2017 as the date for a public hearing on the future of Naftzger Park in downtown Wichita.
-
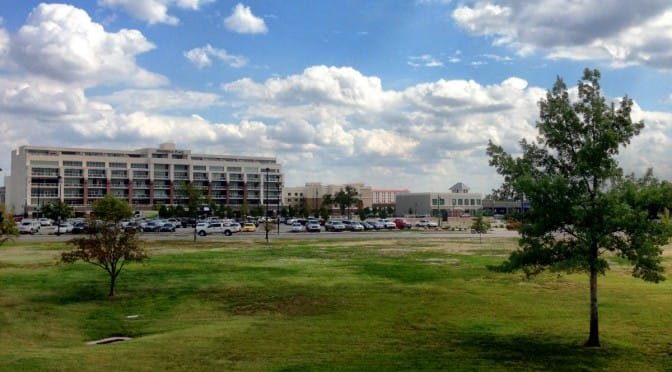
Wichita WaterWalk agreement not followed
Does the City of Wichita enforce its public-private partnership agreements? In some cases the city doesn’t even ask for the information that is needed for enforcement.
-
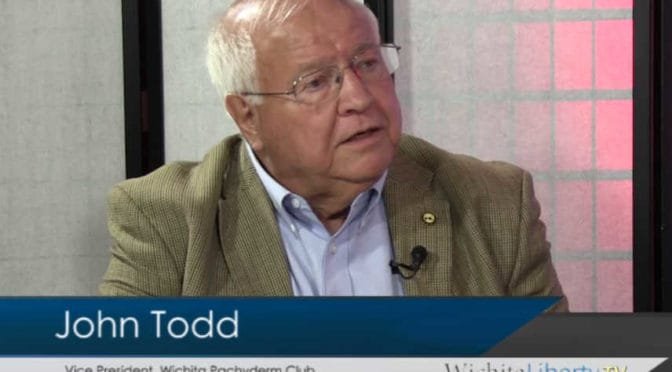
WichitaLiberty.TV: John Todd and Wichita issues
John Todd joins Bob Weeks and Karl Peterjohn to discuss issues involving the City of Wichita, including the future of Naftzger Park and economic development.
-

Deconstructing Don Hineman
Another Kansas legislator explains why raising taxes was necessary. So he says.
-

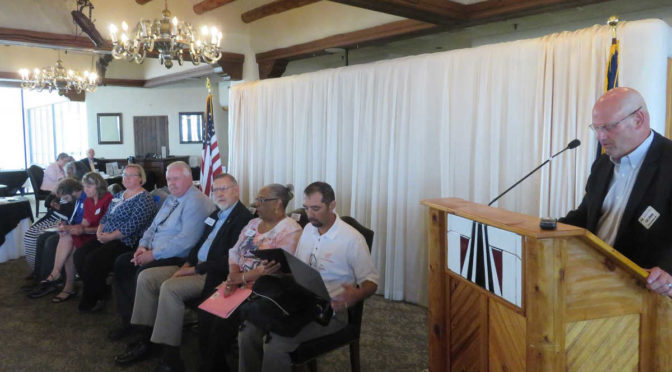
From Pachyderm: Wichita city council candidates
From the Wichita Pachyderm Club this week: Wichita City Council Primary and General Election Candidates. This audio presentation was recorded June 30, 2017.
-
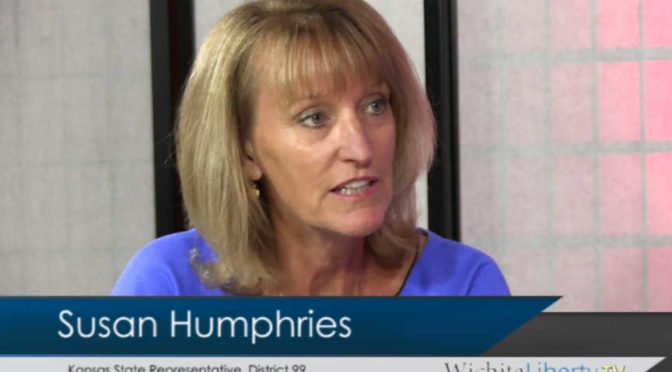
WichitaLiberty.TV: Kansas Representative Susan Humphries
Kansas Representative Susan Humphries joins Bob Weeks and Karl Peterjohn to discuss issues in the Kansas Legislature. Humphries represents District 99 in far east Wichita and Andover, and just completed her first term.
-
Decoding Duane Goossen
When reading the writings of former Kansas State Budget Director Duane Goossen, it’s useful to have a guide grounded in reality.
-

Naftzger Park in Downtown Wichita
An information resource regarding the future of Naftzger Park in downtown Wichita.
-
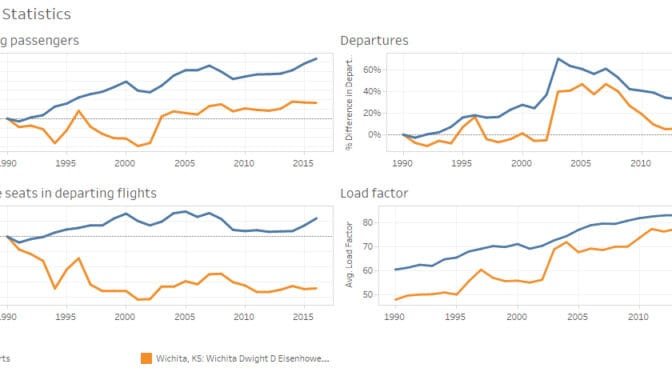
Airport traffic statistics, 2016
Airport traffic data presented in an interactive visualization, updated through 2016.
-
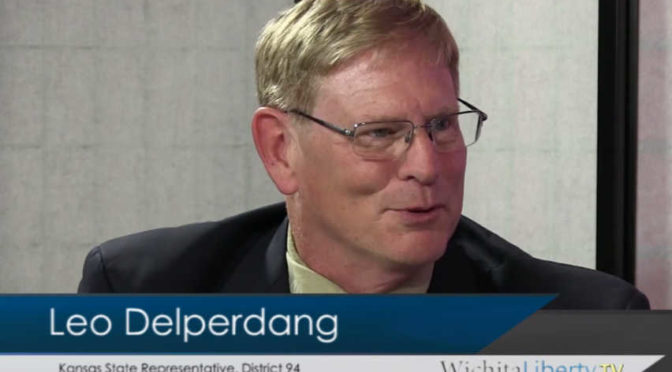
WichitaLiberty.TV: Kansas Representative Leo Delperdang
Kansas Representative Leo Delperdang joins Bob Weeks and Karl Peterjohn to discuss issues in the Kansas Legislature. Delperdang represents District 94 in west Wichita, and just completed his first term.
-

Voting to raise taxes in Kansas
Printable tables of voting on legislation that raised taxes in Kansas.
-
From Pachyderm: Wichita school board candidates
From the Wichita Pachyderm Club: A forum of candidates for Wichita school board. Recorded June 16, 2017.