Tag: Featured
-

Rich States, Poor States, 2107 edition
In Rich States, Poor States, Kansas improves its middle-of-the-pack performance, but continues with a mediocre forward-looking forecast.
-

Which Kansas governor?
In Kansas, a governor is proud of savings and efficiencies.
-
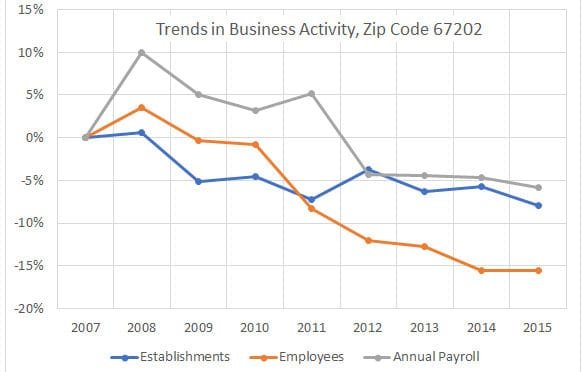
Downtown Wichita business trends
There has been much investment in Downtown Wichita, both public and private. What has been the trend in business activity during this time?
-

Fake government spawns fake news
Discussions of public policy need to start from a common base of facts and information. An episode shows that both our state government and news media are not helping
-
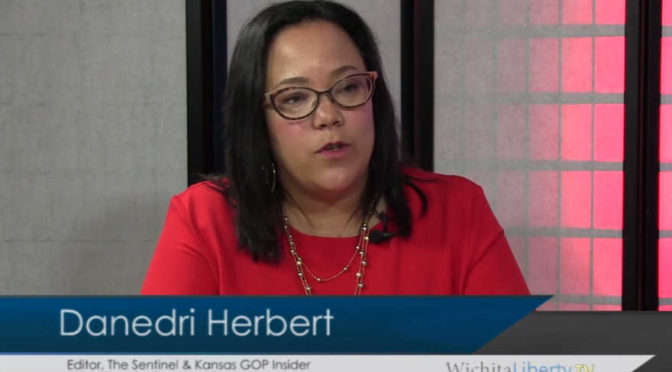
WichitaLiberty.TV: The Sentinel’s Danedri Herbert
Danedri Herbert of The Sentinel joins Bob Weeks and Karl Peterjohn to discuss news reporting and politics in Kansas.
-

Cargill subsides start forming
Details of the subsidy programs used to keep Cargill in Wichita are starting to take shape.
-
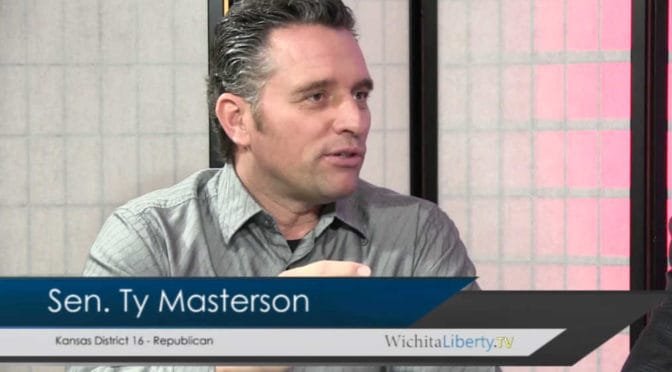
WichitaLiberty.TV: Kansas Senator Ty Masterson
Kansas Senator Ty Masterson joins Bob Weeks and Karl Peterjohn to discuss legislative issues and politics.
-

From Pachyderm: Kansas legislative update
From the Wichita Pachyderm Club: Members of the Kansas Legislature from the Wichita area briefed members and guests on happenings in the Kansas Senate and House of Representatives.
-

For Sedgwick County Commission, too much debate
By moving to end motions and debate, the Sedgwick County Commission isn’t effectively serving citizens and taxpayers. Yesterday’s meeting of the Sedgwick County Commission offered an opportunity to learn how we can improve local government. The issue the commission was considering, significant in its own right, is not important to the following discussion. It’s the…
-
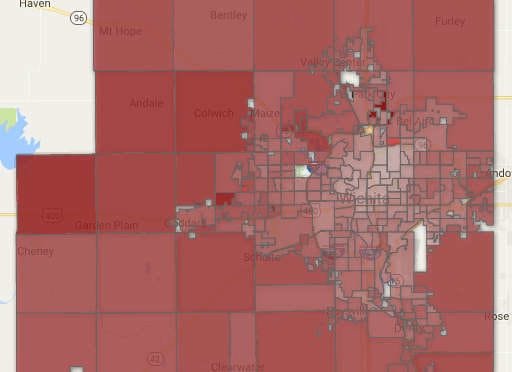
Kansas Special Congressional Election
An interactive map of voting in the special congressional election in Kansas district 4, for Sedgwick County only.
-

Sedgwick County to consider raising debt limit
Tomorrow the Sedgwick County Commission will consider raising its limit on borrowing for reasons which need to be revealed, and then carefully examined.
-

Cash incentives in Wichita, again
The City of Wichita says it does not want to use cash incentives for economic development. But a proposal contains just that.