Tag: Featured
-

Kansas state school board member should practice what he preaches
A Kansas State School Board member urges political leaders to “tell the whole story” but doesn’t practice what he preaches, writes Dave Trabert of Kansas Policy Institute..
-

Towards government transparency in Wichita: Legal notices
Kansas law requires publication of certain notices in newspapers, but cities like Wichita could also make them available in other ways that are easier to use.
-

In Wichita, more sales tax hypocrisy
Another Wichita company that paid to persuade you to vote for higher taxes now seeks to avoid paying those taxes.
-

Best cities for job growth 2016
A computation of job growth in cities produces familiar results for Wichita.
-
Wichita city council campaign finance reform
Some citizen activists and Wichita city council members believe that a single $500 campaign contribution from a corporation has a corrupting influence. But stacking dozens of the same $500 contributions from executives and spouses of the same corporation? Not a problem.
-

Electioneering in Kansas?
An op-ed written under the banner of a non-profit organization appears to violate the ban on electioneering.
-

Kansas economic development programs
Explaining common economic development programs in Kansas.
-

Another bill Kansas Governor Sam Brownback should veto
Kansas Governor Sam Brownback has another opportunity to promote and protect individual liberty by blocking expansion of an ever-growing regulatory state.
-

WichitaLiberty.TV: John Chisholm on entrepreneurship
In this episode of WichitaLiberty.TV: Author John Chisholm talks about entrepreneurship, regulation, economics, and education. View below, or click here to view at YouTube. Episode 119, broadcast May 8, 2016. Shownotes John Chisholm’s new book Unleash Your Inner Company: Use Passion and Perseverance to Build Your Ideal Business at Amazon and its own website. John…
-

Wichita mayor’s counterfactual op-ed
Wichita’s mayor pens an op-ed that is counter to facts that he knows, or should know.
-

Spirit Aerosystems tax relief
Wichita’s largest employer asks to avoid paying millions in taxes, which increases the cost of government for everyone else, including young companies struggling to break through.
-
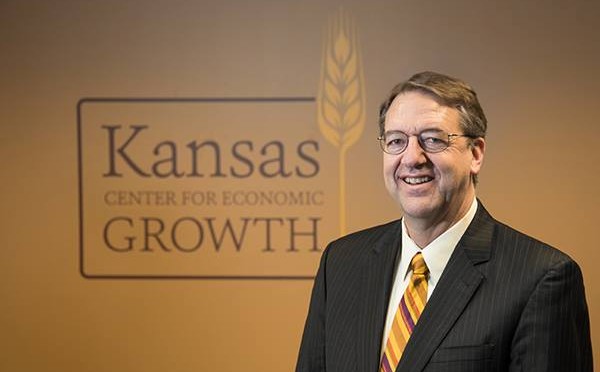
Under Goossen, Left’s favorite expert, Kansas was admonished by Securities and Exchange Commission
The State of Kansas was ordered to take remedial action to correct material omissions in the state’s financial statements prepared under the leadership of Duane Goossen.