Tag: Featured
-

In Sedgwick County, a moral crusade
In Sedgwick County the debate over the budget has the dimension of a moral crusade, except for one thing.
-

In Wichita, an incomplete economic development analysis
The Wichita City Council will consider an economic development incentive based on an analysis that is nowhere near complete.
-

Kansas school funding growing faster than inflation
Kansas school funding has been growing much faster inflation and enrollment, but for some, it will never be enough, and they will continue to use taxpayer money to press their monetary demands, writes Dave Trabert of Kansas Policy Institute.
-
WichitaLiberty.TV: The Sedgwick County budget and more episodes of “Love Gov”
In this episode of WichitaLiberty.TV: As Sedgwick County proposes small spending cuts, those who benefit are vocal in their displeasure. Then, two more episodes from “Love Gov” covering health care and the housing market.
-

In Sedgwick County, expectation of government entitlements
In Sedgwick County, we see that once companies are accustomed to government entitlements, any reduction is met with resistance.
-

Federal rules serve as ‘worms’ buried in promises of ‘free money’
An often unappreciated mechanism throughout the Kansas budget severely limits the ability of legislators and governors to adapt to changing state priorities. A new paper from Kansas Policy Institute explains.
-

Sedgwick County WATC funding trajectory following manager’s recommendations
Sedgwick County taxpayers have been generous with funding for Wichita Area Technical College, and the former county manager has recommended reducing its funding.
-
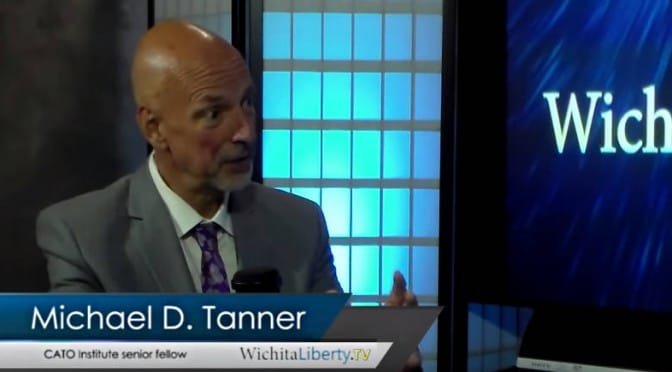
WichitaLiberty.TV: Michael Tanner of Cato Institute on deficits, debt, and entitlements
In this episode of WichitaLiberty.TV: Michael Tanner of the Cato Institute talks about his new book “Going for Broke: Deficits, Debt, and the Entitlement Crisis.” Episode 90, broadcast August 2, 2015.
-

In Wichita, benefitting from your sales taxes, but not paying their own
A Wichita real estate development benefits from the sales taxes you pay, but doesn’t want to pay themselves.
-

Sedgwick County spending beneficiaries overwhelm others
That so many speakers at a public hearing were in favor of government spending is not surprising.
-

The real free lunch: Markets and private property
As we approach another birthday of Milton Friedman, here’s his article where he clears up the authorship of a famous aphorism, and explains how to really get a free lunch
-

Sedgwick County Zoo funding
The Sedgwick County Commission has been generous with zoo funding, spending far more than agreed upon and granting a moratorium on loan payments and interest.