Tag: Featured
-

Block grants a chance for more school choice in Kansas
The block grant school funding bill under consideration in the Kansas Legislature would hold districts harmless for enrollment declines due to school choice.
-

Kansas slips in Tax Foundation business tax climate index
Based on five components of taxation important to business, Kansas ranks twenty-second among the states, two positions lower than last year.
-

Energy subsidies for electricity production, in proportion
To compare federal subsidies for the production of electricity, we must consider subsidy values in proportion to the amount of electricity generated, because the magnitude is vastly different.
-
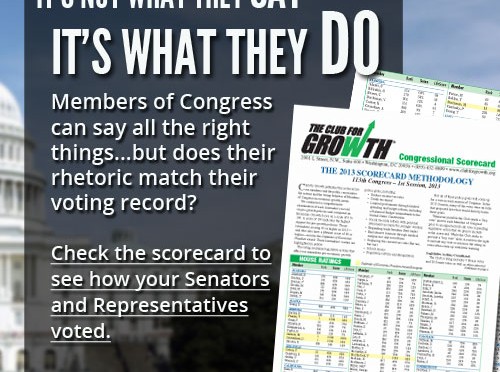
Huelskamp, Pompeo at top of Club for Growth scorecard
Kansans Tim Huelskamp and Mike Pompeo are among the eight U.S. House Members who scored 100 percent for 2014 on Club for Growth’s scorecard.
-

Wichita mayoral candidates at Pachyderm Club
Wichita mayoral candidates Jeff Longwell and Sam Williams at the Wichita Pachyderm Club.
-

A Wichita Shocker, redux
Based on events in Wichita, the Wall Street Journal wrote “What Americans seem to want most from government these days is equal treatment. They increasingly realize that powerful government nearly always helps the powerful …” But Wichita’s elites don’t seem to understand this.
-

Legislation to end Economic Development Administration introduced
U.S. Rep. Mike Pompeo calls for an end to a wasteful federal economic development agency.
-
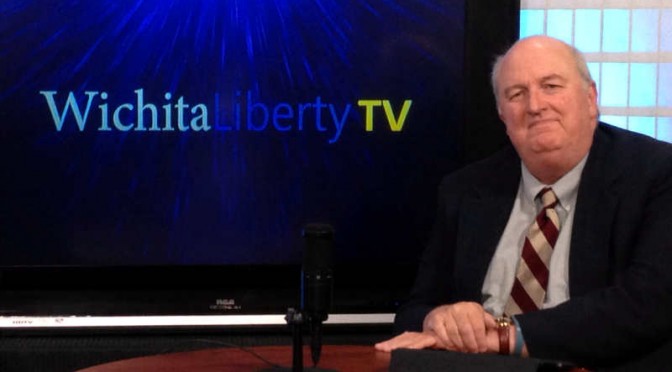
WichitaLiberty.TV: A downtown Wichita deal shows some of the problems with the Wichita economy
In this episode of WichitaLiberty.TV: We’ll examine the city council’s action regarding a downtown Wichita development project and how it is harmful to Wichita taxpayers and the economy.
-

Exchange Place incentives, including free sales tax and an ethics bypass
A downtown Wichita project receives free sales taxes and a bypass of Wichita’s code of conduct for city council members.
-

School choice and state spending on schools
States like Kansas that are struggling to balance budgets could use school choice programs as a way to save money.
-

Rally for school choice in Kansas
Parents and children from around Kansas rallied in the Kansas Capitol for school choice.
-
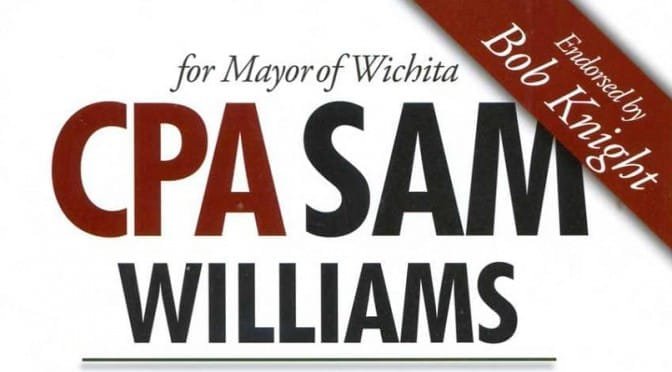
Sam Williams, CPA?
Sam Williams, a candidate for Wichita mayor, is not entitled to use the title “CPA,” according to Kansas law.