Tag: Greater Wichita Partnership
-
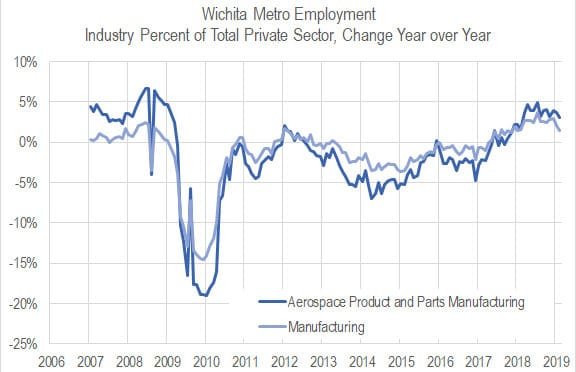
Wichita aerospace manufacturing concentration
Wichita leaders want to diversify the area economy. Has there been progress?
-
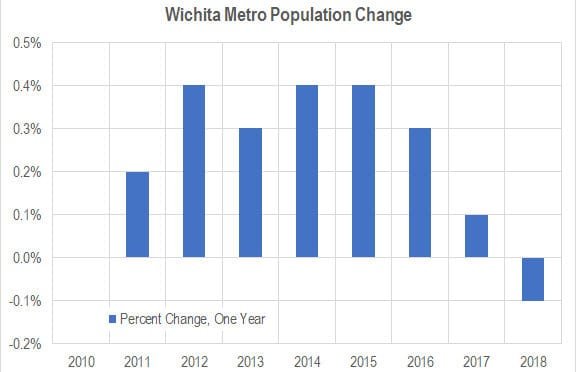
Wichita population falls; outmigration continues
The population of the Wichita MSA fell from 2017 to 2018, and net domestic migration continues at a high level.
-
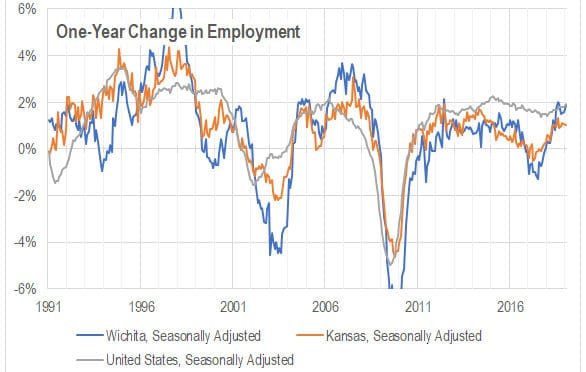
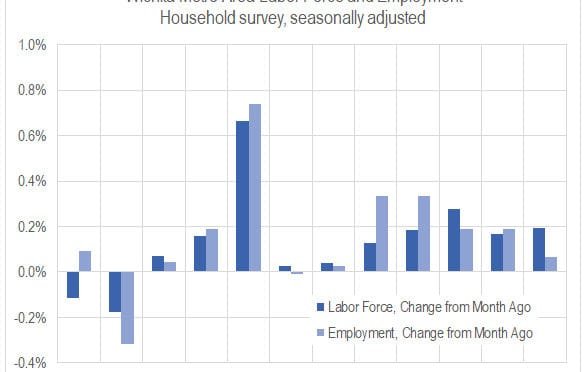
Wichita jobs and employment, February 2019
For the Wichita metropolitan area in February 2019, jobs are up, the labor force is up, and the unemployment rate is down when compared to the same month one year ago. Seasonal data shows a return to job growth.
-
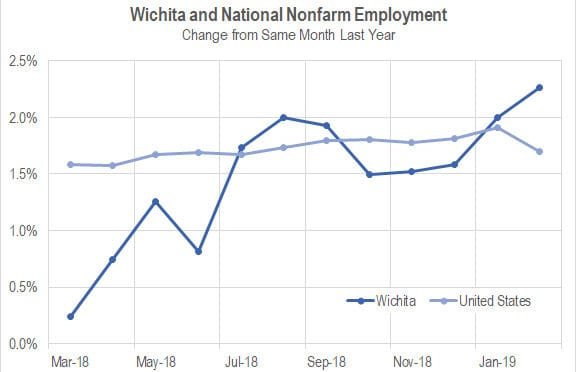
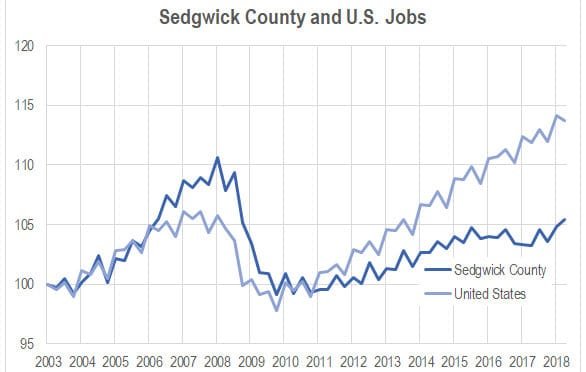
Wichita and national jobs
Growth of employment in Wichita compared to the nation.
-
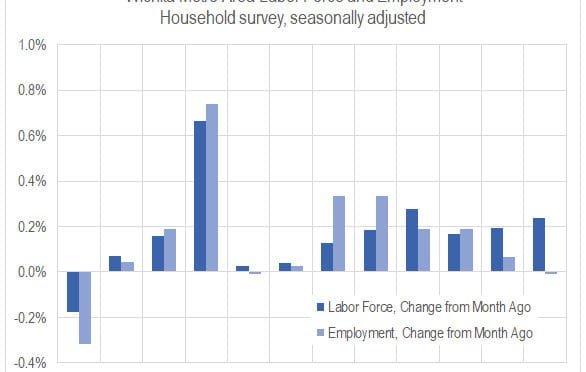
Wichita jobs and employment, January 2019
For the Wichita metropolitan area in January 2019, jobs are up, the labor force is up, and the unemployment rate is unchanged when compared to the same month one year ago. Seasonal data shows a slowdown in the rate of job growth and a rising unemployment rate.
-

In Wichita, respecting the people’s right to know
The City of Wichita says it values open and transparent government. But the city’s record in providing information and records to citizens is poor, and there hasn’t been much improvement.
-
Sedgwick County job growth exceeds national rate
In the third quarter of 2018, Sedgwick County quarterly job growth exceeded the national rate for the first time in nearly ten years.
-

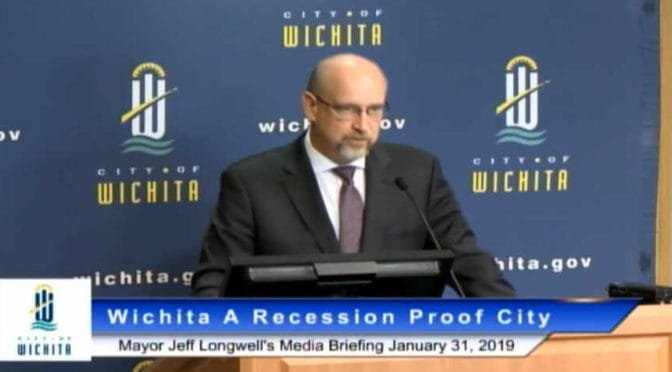
Is the Wichita mayor satisfied with this?
A gloomy jobs forecast is greeted with apparent approval by Wichita Mayor Jeff Longwell.
-
Wichita mayor promotes inaccurate picture of local economy
Wichita city leaders will latch onto any good news, no matter from how flimsy the source. But they ignore the news they don’t like, even though it may come from the U.S. Census Bureau, U.S. Bureau of Labor Statistics, or U.S. Bureau of Economic Analysis.
-
Wichita jobs and employment, December 2018
For the Wichita metropolitan area in December 2018, jobs are up, the labor force is up, and the unemployment rate is down when compared to the same month one year ago. Seasonal data shows a slowdown in the rate of job growth and a rising unemployment rate.
-

In Wichita, a gentle clawback
Despite the mayor’s bluster, Wichita mostly lets a company off the hook.
-

Wichita migration not improving
Data from the United States Census Bureau shows that the Wichita metropolitan area has lost many people to domestic migration, and the situation is not improving.